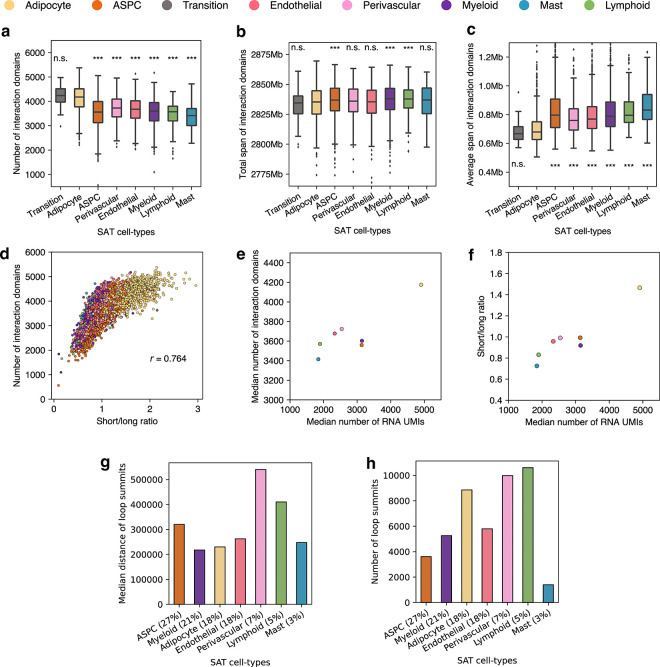
Extended Data Figure 6. Cell-type specificity in interaction domains and loops.
a-c, Box plots visualizing the distribution of the number of interaction domains (a), the total number (b) and the average span (c) of interaction domains detected in each cell, stratified by cell-types. Asterisks indicate the level of statistical significance of a pairwise paired Wilcoxon test against adipocytes; *** indicates adjusted P<0.05 and n.s. denotes non-significant. d, Scatter plot showing the short to long-range interaction ratio per cell against the number of interaction domains detected. Cells are colored by its snm3C-seq annotation. e-f, Scatter plots showing the aggregated cell-type level median number of UMIs detected in cells by snRNA-seq against the median number of interaction domains (e) and the ratio of short to long-range interaction contacts (f) detected in cells by snm3C-seq, colored similarly as in d. g-h, Bar plots showing the median distance (g) and the total number (h) of loop summits detected across the SAT cell-types (x-axis is ordered by the abundance in snm3C-seq). ASPC indicates adipose stem and progenitor cells.

