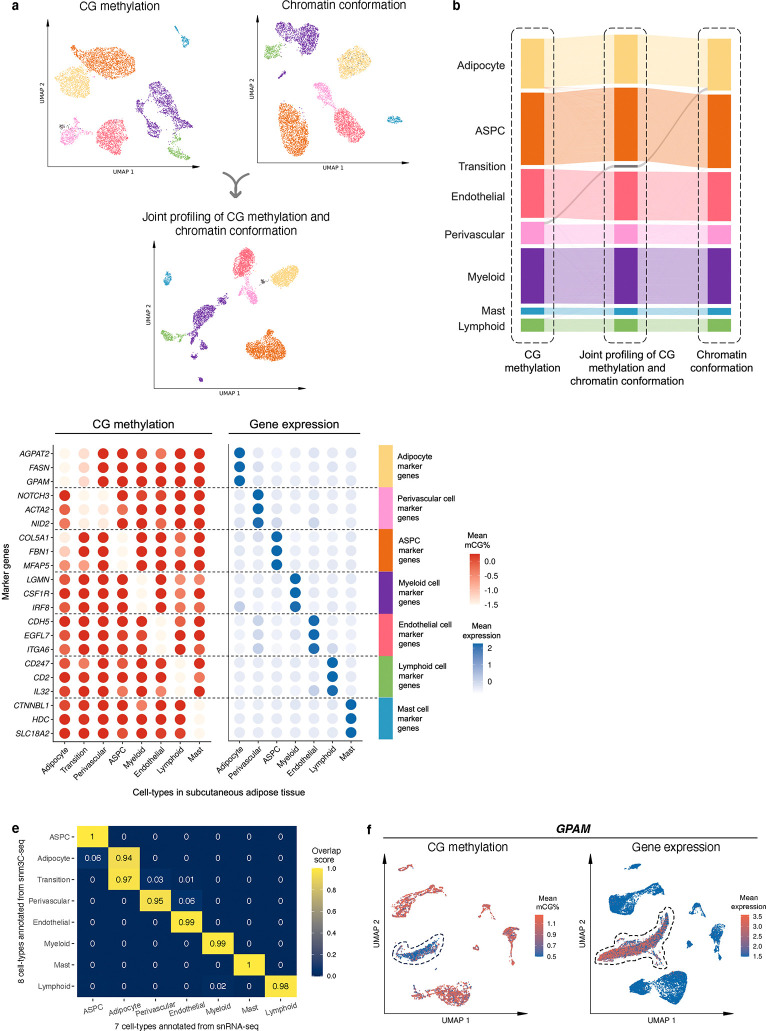
Figure 2. Single-nucleus level multi-omic profiles of SAT by jointly profiling methylation and chromatin conformation with snm3C-seq, followed by an integrative analysis with transcriptomic profiles, generated using SAT snRNA-seq.
a, Dimension reduction of cells using 5-kb bin mCG (top left), 100-kb bin chromatin conformation (top right), and jointly integrating mCG and chromatin conformation (bottom), profiled by single nucleus methyl-3C sequencing (snm3C-seq) and visualized with uniform manifold approximation and projection (UMAP). Cells are colored by cell-types of subcutaneous adipose tissue (SAT). b, Sankey diagram showcases the high consistency among the SAT cell-type annotations derived from the 5-kb bin mCG (left), 100-kb bin chromatin conformation (right), and joint profiling of mCG and chromatin conformation (middle), with the exception of the transition cell-type cluster that is annotated as perivascular cells by mCG and adipocytes by chromatin conformation. c-f, Integrative analysis with snRNA-seq, evaluating the concordance of cell-type cluster annotations and cell-type marker genes across the used modalities. c, Comparison of gene-body mCG and gene expression profiles of cell-type marker genes across the matching SAT cell-types, independently identified within the respective modalities, excluding the expression profiles of the transition cell-type cluster that was not identified in the SAT snRNA-seq data. Dot colors represent the average gene-body mCG ratio normalized per cell (left), and the average log-transformed counts per million normalized gene expression (right). d, Co-embedding of snm3C-seq gene-body mCG and snRNA-seq gene expression, visualized with UMAP. Cells are colored by the SAT cell-types identified in c (top) and modalities (bottom). e, Concordance matrix comparing the snm3C-seq and snRNA-seq derived annotations, colored by the overlapping scores between the pairs of the SAT cell-types evaluated in the co-embedding space. f, UMAP visualization of the gene-body mCG ratio (left) and gene expression (right) for one adipocyte marker gene, GPAM, colored per cell similarly as in c. ASPC, adipose stem and progenitor cell.

