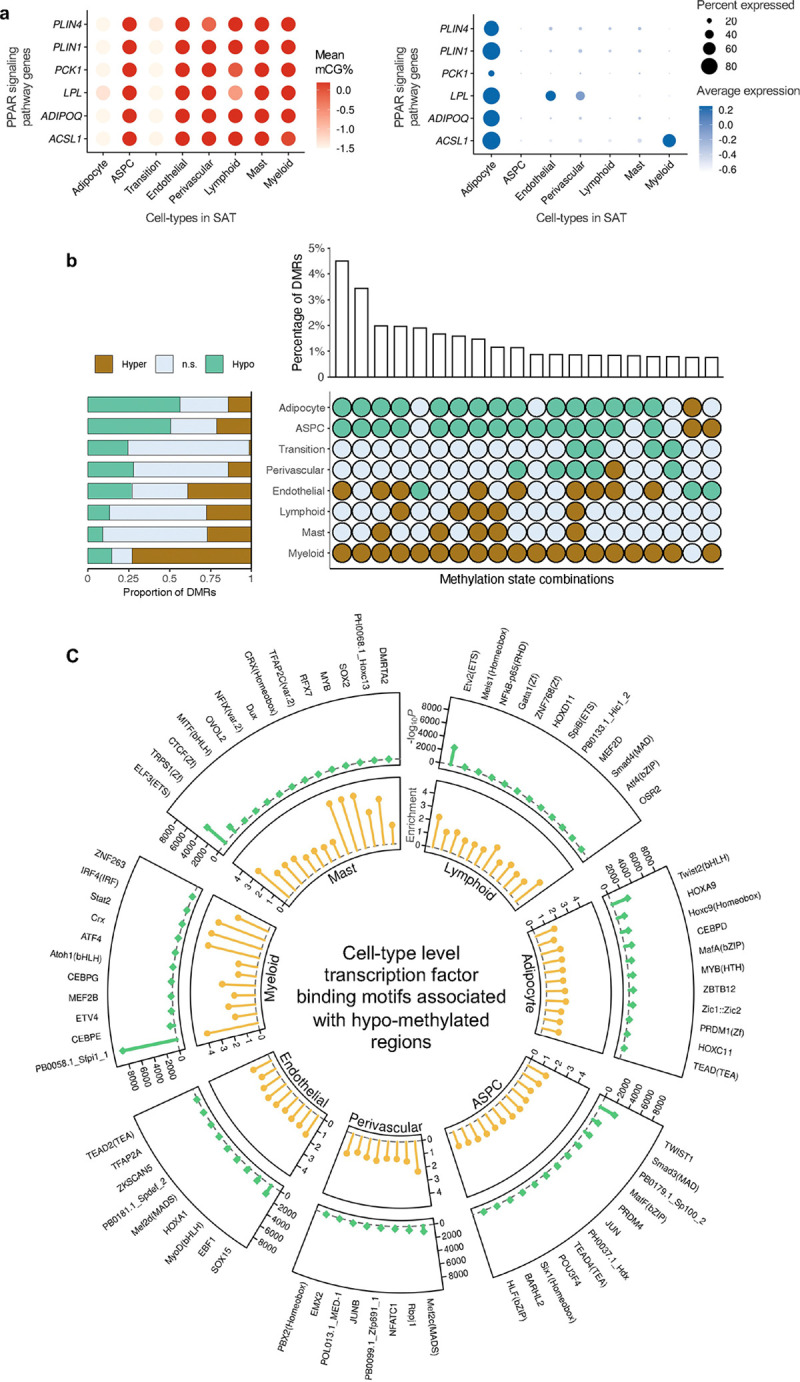
Figure 3. Functional pathways and gene regulatory potential of cell-type level gene-body mCG markers and differentially methylated regions.

a, Dot plots of PPAR signaling pathway genes (ACSL1, ADIPOQ, LPL, PCK1, PLIN1, and PLIN4) that are shared adipocyte marker genes between the gene-body mCG and gene expression modalities, showing their gene-body mCG (left) and gene expression profiles (right) across the SAT cell-types. The color of the dot represents the mean percentage of mCG (left, red is high) and average expression of genes (right, blue is high), while the size of the dot represents the percentage of cells where the gene is expressed (right). b, Horizontal stacked bar plot (left) showing the marginal proportions of assigned methylation states across differentially methylated regions (DMRs) for each SAT cell-type (n.s. denotes non-significant) and upset plot (right) showing the top 20 combinations of methylation states across DMRs in decreasing order with their corresponding percentages. c, Circular plot summarizing the cell-type-specific transcription factor (TF) binding motifs associated with hypo-methylated regions in SAT cell-types. The outermost layer shows the names of cell-type-specific and significantly (P<1×10⁻¹²) enriched TFs in each SAT main cell-type. Track 1 shows the negative logarithmic of the P value (green lollipop) and track 2 shows the enrichment score (yellow lollipop). ASPC, adipose stem and progenitor cell, and FDR, false discovery rate.
