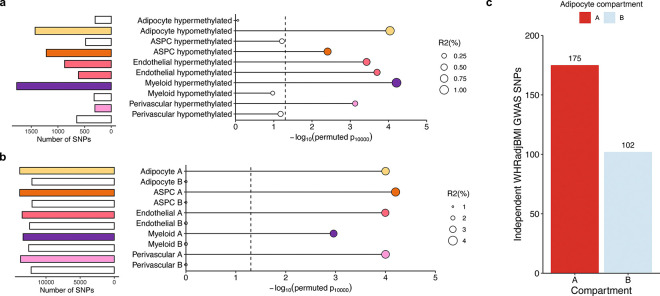
Figure 6. Partitioned abdominal obesity PRSs of several cell-type level DMRs and all cell-type level A compartments are enriched for variance explained in abdominal obesity, and 63.2% of non-redundant abdominal obesity GWAS variants land in adipocyte A compartment.
a-b, Lollipop plots depict the incremental variance explained of each cell-type level PRS for abdominal obesity (using waist-hip-ratio adjusted for body mass index (WHRadjBMI) as a proxy) from the (a) DMRs, and (b) A and B compartments. Each lollipop represents a WHRadjBMI PRS, where the dot size corresponds to the incremental variance explained of the PRS. The grey vertical dotted line indicates the cutoff for significant enrichment of incremental variance explained (Pperm10,000<0.05). On the left, horizontal bar-plots depict the number of SNPs used for the PRS construction. We color each bar and lollipop by the cell-type, where PRSs without a significant enriched PRS are outlined in grey without a filling. c, Bar plot showing the number of independent (r2<0.1) WHRadjBMI GWAS variants, passing genome-wide significance (P<5×10⁻⁸), from the WHRadjBMI GWAS, conducted in 195,863 individuals from the UK Biobank, grouped by the adipocyte compartment assignment. We shade each bar by compartment, where the A compartment is colored red and B compartment blue.

