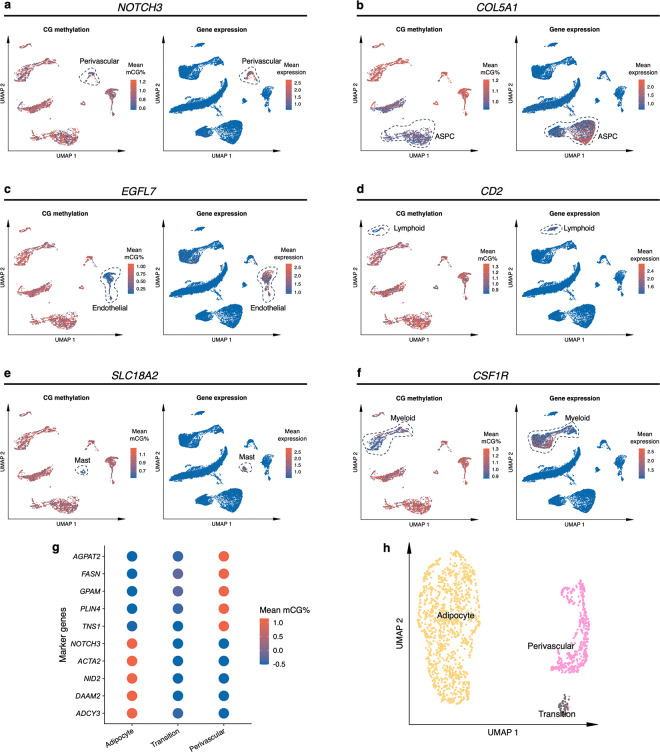
Extended Data Figure 2. Gene-body mCG and RNA expression profiles across SAT cell-type marker genes and clustering analysis of the transition cell-type.
a-f, Uniform manifold approximation and projection (UMAP) visualization of the gene-body mCG ratio, normalized per cell (left) and log-transformed counts per million normalized gene expression (right) for perivascular marker gene NOTCH3 (a), ASPC marker gene COL5A1 (b), endothelial cell marker gene EGFL7 (c), lymphoid cell marker gene CD2 (d), mast cell marker gene SLC18A2 (e), and myeloid cell marker gene CSF1R (f). g, Gene-body hypo-methylation of adipocyte marker genes (top 5 rows) and perivascular cell marker genes (bottom 5 rows) across adipocytes, perivascular cells, and the transition cell-type. Dot colors represent the average gene-body mCG ratio normalized per cell. h, Dimension reduction of cells profiled by snm3C-seq and restricted to adipocytes, perivascular cells, and the transition cell-type, using exclusively the 5-kb bin mCG profiles and visualized with UMAP. ASPC indicates adipose stem and progenitor cells.

