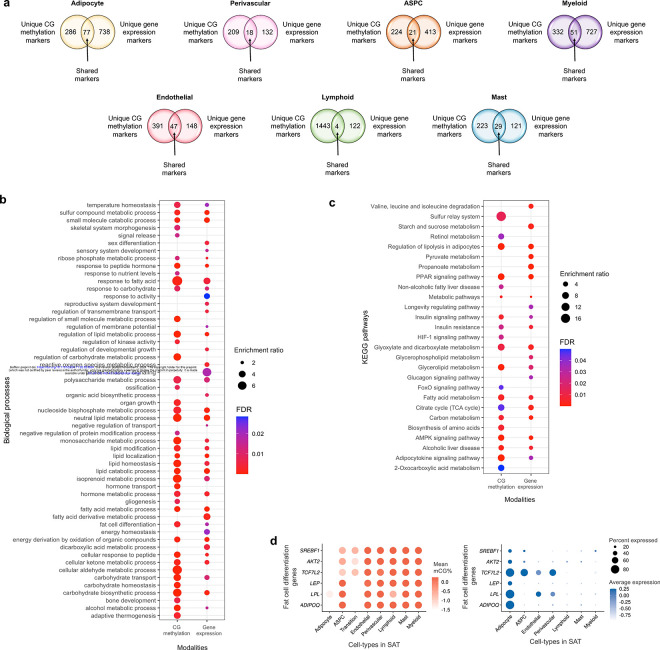
Extended Data Figure 3. Comparisons of unique cell-type marker genes in SAT cell-types, and biological processes and functional pathways enriched among the adipocyte marker genes between the gene-body mCG and gene expression modalities.
a, Venn diagrams showing the number of shared and modality-specific unique SAT cell-type marker genes (adipocytes, perivascular cells, ASPCs, myeloid cells, endothelial cells, lymphoid cells, and mast cells) between the gene-body mCG and gene expression modalities. b-c, Dot plots showing significantly (FDR<0.05) enriched biological processes (b) and KEGG functional pathways (c) using unique adipocyte marker genes in gene-body mCG and gene expression modalities. The size of the dot represents the enrichment ratio for biological processes (b) and KEGG functional pathways (c), while the color of the dot indicates FDR (blue is highly significant) (b-c). d, Dot plots of fat cell differentiation biological process genes (ADIPOQ, LPL, LEP, TCF7L2, AKT2, and SREBF1) that are shared adipocyte marker genes between the mCG and gene expression modalities, showing their gene-body mCG (left) and gene expression profiles (right) across the SAT cell-types. The color of the dot represents the mean percentage of mCG (left, red is high) and average expression of genes (right, blue is high), while the size of the dot represents the percentage of cells where the gene is expressed (right). ASPC indicates adipose stem and progenitor cells and FDR, false discovery rate.

