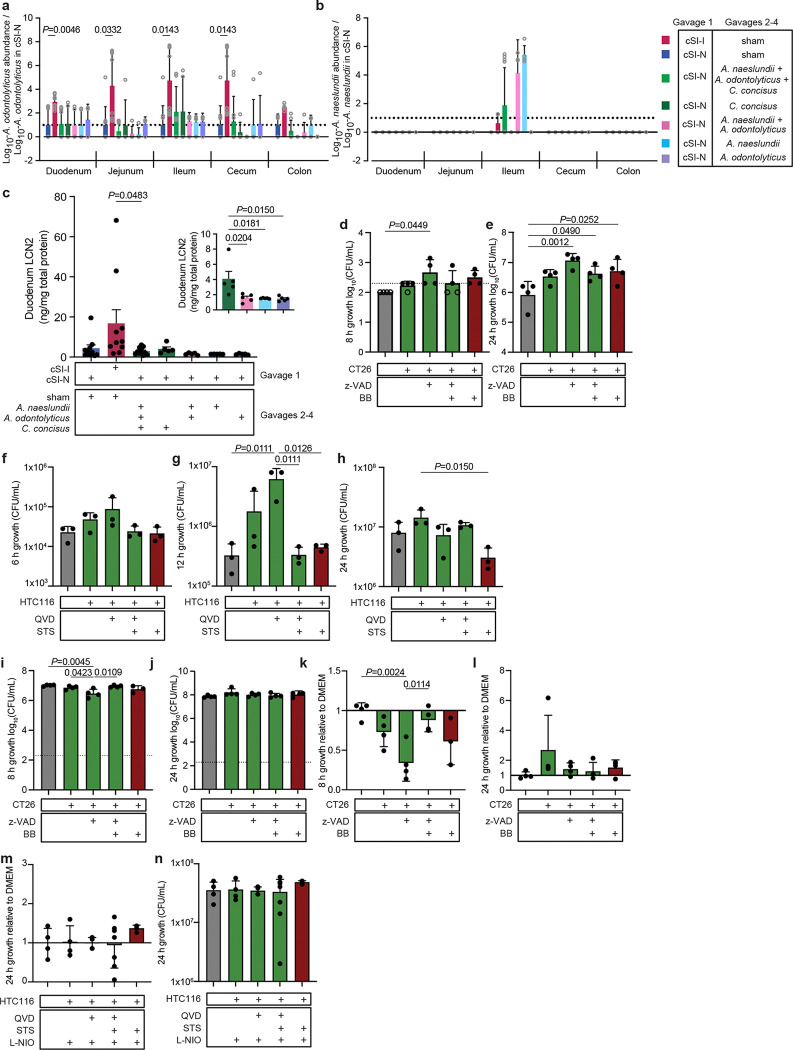
Extended Data Fig. 7. Abundance of Actinomyces in isolate ‘add-in’ experiments and C. concisus growth in colonic epithelial supernatants.
a,b, Mice were initially colonized with either the cSI-N or cSI-I consortium (‘gavage 1’). Gavages 2–4 were performed on experimental days 9–11, as in Fig. 5a. The absolute abundances of A. odontolyticus isolate Bg044 (corresponding to MAG044, panel a) and A. naeslundii isolate Bg041 (corresponding to MAG041, panel b), shown relative to their absolute abundance in the cSI-N/sham-gavaged controls (a ratio of 1 is indicated by dotted line; mixed-effects analysis with Dunnett’s multiple comparisons to cSI-N/sham control; mean values ± s.d. are shown.) c, Levels of LCN2 protein in duodenal tissue on experimental day 18 (one-way ANOVA with Tukey’s multiple comparisons; mean values ± s.e.m. are shown). Insets show comparisons between individual isolates. For a-c, n=5–11 mice/group combined across two independent experiments. d,e, Microaerophilic growth of C. concisus after 8 (d), or 24 hours (e), in mouse CT26 colonic epithelial cell line supernatants that were live (green; CT26:FADD, z-VAD, z-VAD+BB) or were treated with an inducer of apoptosis (red; BB) (n=4 biological replicates per condition). Points shown with an open rather than filled circle denote abundances that were below the limit of detection at the time of quantification and are presented at the limit of detection of the assay. f-h, Microaerophilic growth of C. concisus after 6 (f), 12 (g), or 24 (h) hours in HTC116 human colonic epithelial cell line supernatants that were live (green; QVD, QVD+STS) or were treated with an inducer of apoptosis (red; STS) (n=3 biological replicates/condition). i-l, Anaerobic growth of C. concisus after 8 hours (i, k) or 24 hours (j, l) of incubation in CT26 mouse colonic epithelial cell line supernatants prepared from live cells (green; CT26:FADD, z-VAD, z-VAD+BB) or cells that had been treated with an inducer of apoptosis (red; BB). Panels k and l show growth relative to DMEM medium control (n=4 biological replicates/condition). m,n, Anaerobic growth of C. concisus after 24 hours of incubation in HTC116 cell supernatants prepared from live cells (green; QVD, QVD+STS) or cells that had been treated with an inducer of apoptosis (red; STS). All cells were treated with an inhibitor of nitric oxide synthase (L-NIO). Panel m shows differences in growth compared to medium controls; n, total bacterial growth (n=4 biological replicates/condition). For d-n, bars denote mean ± s.d., P-values determined with one-way ANOVA and Tukey’s multiple comparisons. C. concisus growth in supernatants acquired from live cells and live cell controls are colored in green; apoptotic cells, in red. FADD, Fas-associated death domain; z-VAD, z-VAD-FMK (pan-caspase inhibitor); BB, B/B Homodimerizer (induces FADD-dependent cell death); QVD, Quinoline-Val-Asp-Difluorophenoxymethylketone (caspase inhibitor); STS, Staurosporine (apoptosis inducer); L-NIO, N5-(1-Iminoethyl)-L-ornithine, dihydrochloride (nitric oxide synthase inhibitor).

