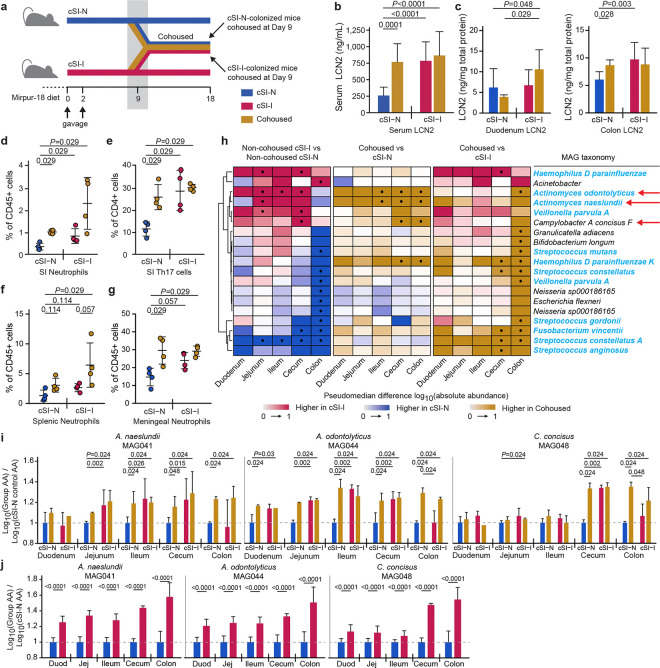
Fig. 4. Identification of bacteria that transfer from cSI-I to cSI-N mice in cohousing experiments and induce enteropathy.
a, Experimental design of cohousing experiment. b, Serum levels of LCN2 protein on experimental day 18, 9 days after initiation of cohousing (n=14 mice/control group, n=7 mice/cohoused group). c, Intestinal tissue levels LCN2 measured on experimental day 18, 9 days after cohousing (n=8 mice/control group, n=4 mice/cohoused group). d,e, Frequency of neutrophils (d), and Th17 cells (e), in the small intestinal lamina propria (n=4 mice/group; duodenal, jejunal and ileal segments were combined prior to analysis). f,g, Frequency of neutrophils in the spleen (f), and meninges (g), (n=4 mice/group). For panels d-f, each point represents an individual animal; the color code matches that used in panel a. h, Differences in absolute abundances of MAGs along the length of the gut (n=6 mice/group). MAGs were included if they demonstrated statistically significant differences in their absolute abundance for any comparison between groups in at least one segment of the intestine. MAG taxonomy highlighted in blue indicates correspondence to ASVs representing ‘core taxa’ in the small intestinal microbiota of Bangladeshi children with EED in the BEED study. The three red arrows point to MAGs defined as ‘pathology-associated’. • P-adj < 0.05. i,j, Log10 absolute abundances of the pathology-associated MAGs (MAG041, MAG044 and MAG048) along the length of the intestine in either the cohousing experiment (i) or P37 animals from the intergenerational experiment (j). Values are expressed relative to P37 cSI-N offspring in the intergenerational transmission experiment (n=22–25 mice/group) or to cSI-N non-cohoused controls (n=6 mice/control group and n=3/cohoused groups). For b-j, P-values were determined by Wilcoxon rank-sum test; mean values ± s.d. are shown in b-g, i-j.

