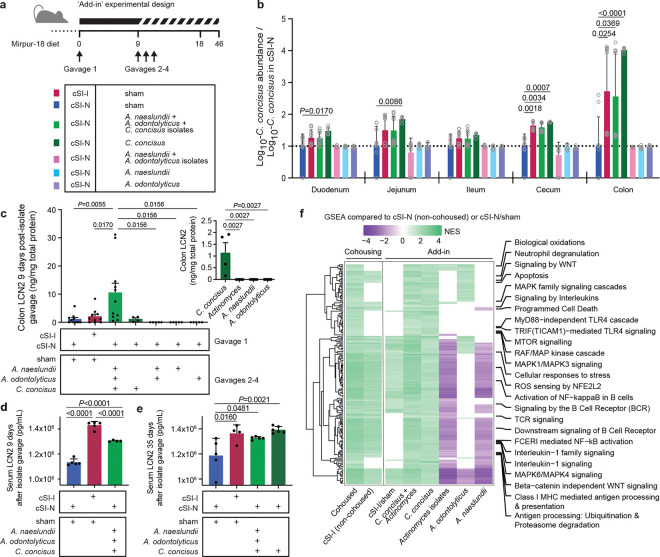
Fig. 5. Direct test of candidate pathology-inducing small intestinal bacterial strains in cSI-N mice.
a, Experimental design of ‘add-in’ experiment. Individual cultured isolates, alone or in combinations, were gavaged once daily on days 9–11 into mice previously colonized with the cSI-N bacterial consortium. b, Ratio of the absolute abundance of C. concisus strain Bg048 (corresponding to MAG048) shown relative to its absolute abundance in cSI-N/sham controls (a ratio of 1 is indicated by the dotted line; two-way ANOVA with Dunnett’s multiple comparisons to cSI-N/sham control; mean values ± s.d. are shown). Colors correspond to the groups shown in panel a. c, Levels of LCN2 protein in colonic tissue measured on experimental day 18, 9 days after isolate gavage. The inset shows colonic LCN2 levels after addition of the individual isolates alone (one-way ANOVAs with Tukey’s multiple comparisons; mean values ± s.e.m. are shown). d,e, Serum LCN2 at 9 (c), or 35 days (d), following secondary gavage (mean ± s.d. shown, one-way ANOVAs with Tukey’s multiple comparisons). f, Normalized enrichment scores (NES) for all Reactome pathways that were significantly enriched in the colon (GSEA q-value <0.05) of the indicated treatment groups compared to their respective cSI-N counterparts (non-cohoused cSI-N controls, or cSI-N/sham). Pathways related to the immune system are labeled. Pathways were included in the heatmap if they were significantly enriched with the addition of C. concisus and in cohoused animals. If a pathway was not significantly enriched, it was assigned a NES score of zero. For panels b, c, f, n=5–11 mice/group combined across two independent experiments. For d and e, n=5 mice/group in a third independent experiment.

