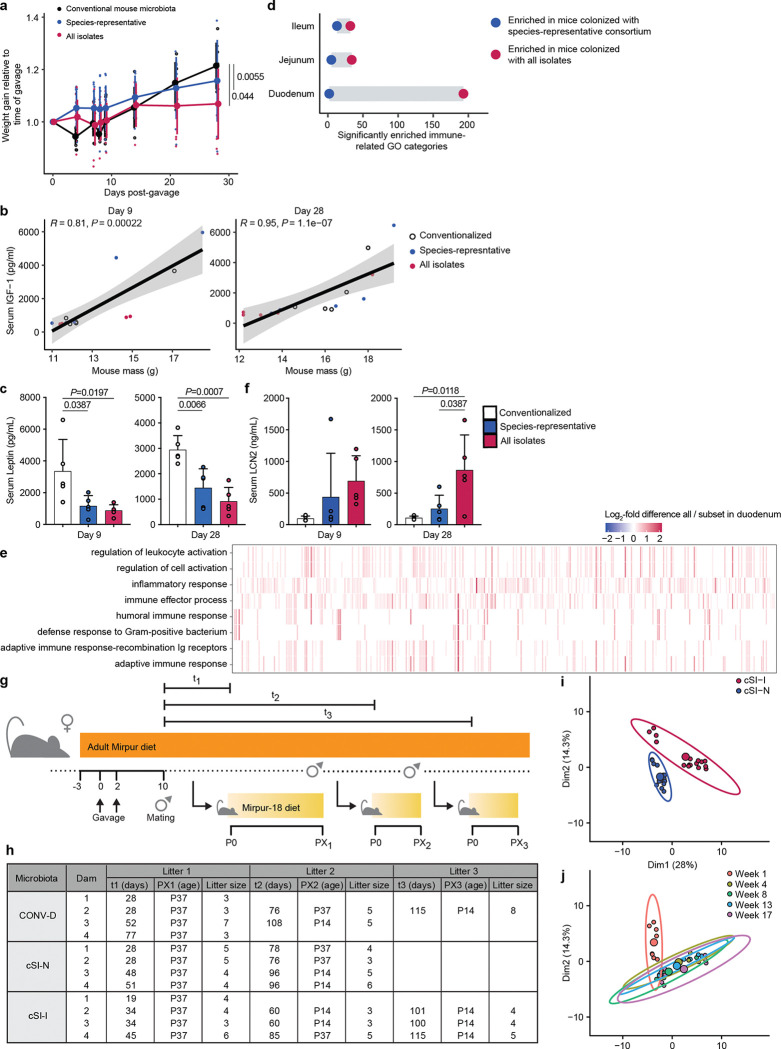
Extended Data Fig. 1. Preliminary test of non-enteropathy inducing control bacterial consortium.
a, Weight gain of mice colonized with all isolates cultured from children with EED (n=186), or a species-representative set of isolates (n=39). Control group was colonized with cecal microbiota from conventionally-raised mice. Each small point represents the weight gain for an individual mouse; larger points denote the mean, error bars, standard deviation. n=5–10 mice/group, linear mixed effects model. b, Serum IGF-1 correlates with mouse weight measured nine (left) or 28 (right) days after colonization (n=5 mice per group per timepoint, linear regression). c, Serum leptin levels determined nine (left) or 28 days (right) days post-colonization (n=5 mice per group per timepoint, bars denote mean ± s.d.). d, Number of Gene Ontology (GO) categories related to the immune system that were significantly enriched (GSEA q value < 0.05) based on differential gene expression in the small intestine of mice colonized with all isolates (red) versus the species representative subset (blue). Bulk RNA-seq was performed in duodenal, jejunal, and ileal tissue 28 days following gavage (n=5 mice/group). e, Expression of genes (columns, un-labeled) that comprise the leading edge of the eight GO categories most significantly enriched in animals colonized with the full consortium (red) compared to the species-representative subset (blue). Bulk RNA-seq of duodenal tissue, 28 days post colonization. f, Serum lipocalin-2 (LCN2) levels nine (left) or 28 days (right) days post-gavage of the consortia (n=5 mice per treatment group per timepoint, bars denote mean ± s.d.). g, Design of the intergenerational transmission experiment. h, Summary of animals collected during intergenerational experiment. Litter sizes and the age of offspring at the time of sample collection are shown for each dam (n=4 dams/group). t1–t3 denotes the number of days between first mating and birth of the litter. i,j, Principal component analysis of MAGs in feces of dams ordinated by their log10 absolute abundance and colored by bacterial consortium (i) or timepoint (j). The composition of community membership differs significantly between cSI-I and cSI-N dams (i, P=0.01, PERMANOVA) but is stable after the first week of colonization (j, P=0.09, PERMANOVA weeks 4 through 17). Each small point represents a fecal sample from one animal. Larger filled circles are the centroids for the ellipses shown, which denote the 95% confidence interval.

