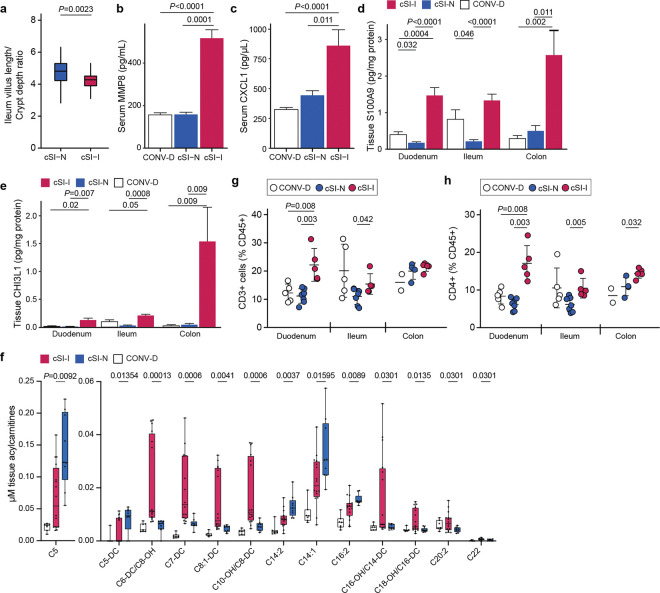
Extended Data Fig. 3. Assessment of EED biomarkers and immune profiling of P37 animals.
a, Ratio of villus length to crypt depth in the ileums of cSI-I and cSI-N mice (n=5 mice/group, Wilcoxon rank-sum test; boxes denote interquartile range). b,c, Levels of serum MMP8 (b), and CXCL1 (c), in the P37 offspring of C57Bl/6J dams colonized with the cSI-I or cSI-N consortia, or with mouse microbiota harvested from the cecal contents of conventionally-raised (CONV-D) C57Bl/6J mice (n=21–25 mice/group). d,e, Levels of S100A9 (d), and CHI3L1 (e), in the duodenal, ileal, and colonic tissue of P37 animals (n=7–10 animals/group). f, Concentration of acylcarnitines in small intestinal tissue of P37 animals. Acylcarnitines shown exhibited a significant difference between cSI-I versus cSI-N groups (n=7–16 mice/group, Mann-Whitney tests with Benjamini, Krieger, Yekutieli two-stage step up FDR correction, q-values shown). g,h, Frequency of CD3+ (g), and CD4+ (h), cells in duodenal, ileal and colonic lamina propria (n=4–7 mice/group, except for colonic tissue collected from CONV-D animals for which n=2 and a statistical comparison was excluded). For panels b-e and g-h, bars denote mean ± s.d. and P-values were determined by Wilcoxon rank-sum tests.

