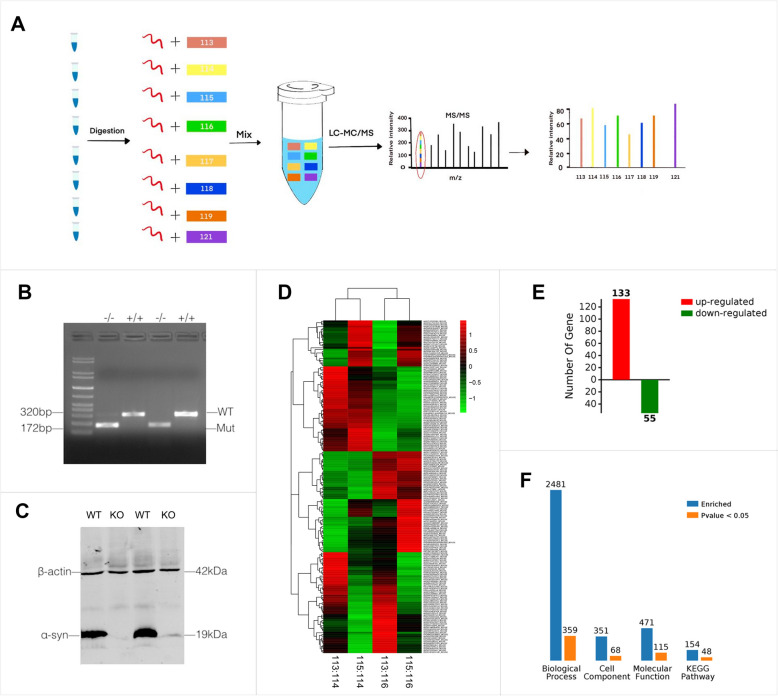
Fig. 3.
Identification of differentially expressed proteins in α-syn null mice by iTRAQ based LC–MS. A Flow chart for differentially expressed proteins identification. B, C Genotyping and western blotting to confirm the mice genotype. D The heatmap for the differentially expressed proteins. In the heatmap, red color represents up-regulated differentially expressed proteins and the green color represents down-regulated differentially expressed proteins. E statistical summary for differentially expressed proteins. A total of 188 proteins, can be seen in the figure in the difference comparison group. There are 133 pcs of up-regulation (red) of the protein and 55 pcs of down-regulation (green) of the protein. F All the differences in protein GO enrichment (BP, CC, MF) and pathway KEGG enrichment results and significant (p < 0.05) number were summarized. The blue column represents the total number of enrichment, orange column represents a significant number of enrichment. A protein is usually involved in a number of functions or pathways, so the total number of GO enrichment and pathway KEGG enrichment results will be far greater than the number of differentially expressed proteins. The significant function or the pathway means that the difference of the enrichment to the function or the pathway is significant

