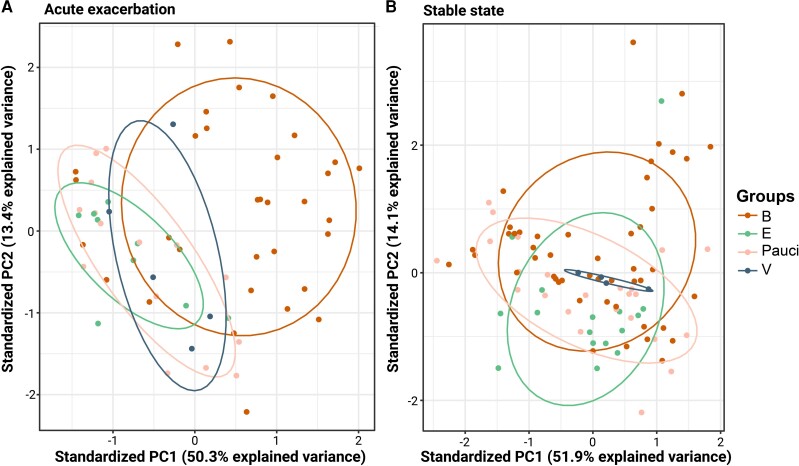
Figure 4.
Principal component analysis (PCA) distinguishes a cluster of bacterial exacerbation state (EX) samples from other exacerbation types and disease states. PCA scatterplots, each dot represents 1 sample, color-coded by exacerbation type. A, PCA of 63 EX sputum samples, 1 per participant. B, PCA of 93 stable state samples, 1 per participant. Abbreviations: B, bacterial; E, eosinophilic; PC, principal component; V, viral.

