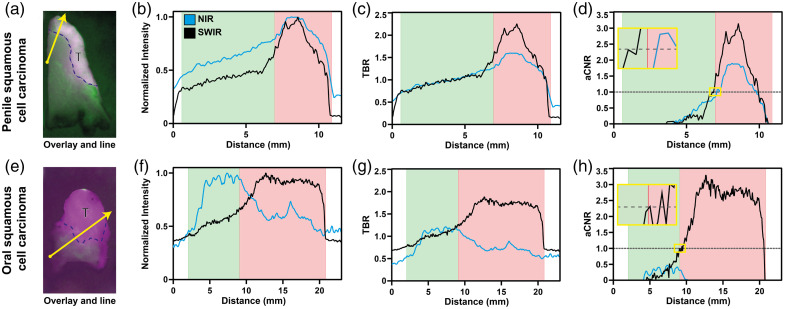
Fig. 8.
Representative examples of penile and oral squamous cell carcinoma. (a) (e) Overlays of registered NIR and SWIR fluorescence images, segmented tumor tissue (T), and line chosen for plotting values (yellow arrow). (b)–(d)/(f)–(h) Plots of normalized intensity, TBR, and aCNR, respectively, for NIR (black line) and SWIR (blue line). The red area represents tumor tissue, and the green area represents healthy tissue, as segmented by a pathologist. The yellow highlighted inset in panels d and h shows an enlargement of the aCNR = 1 crossing.

