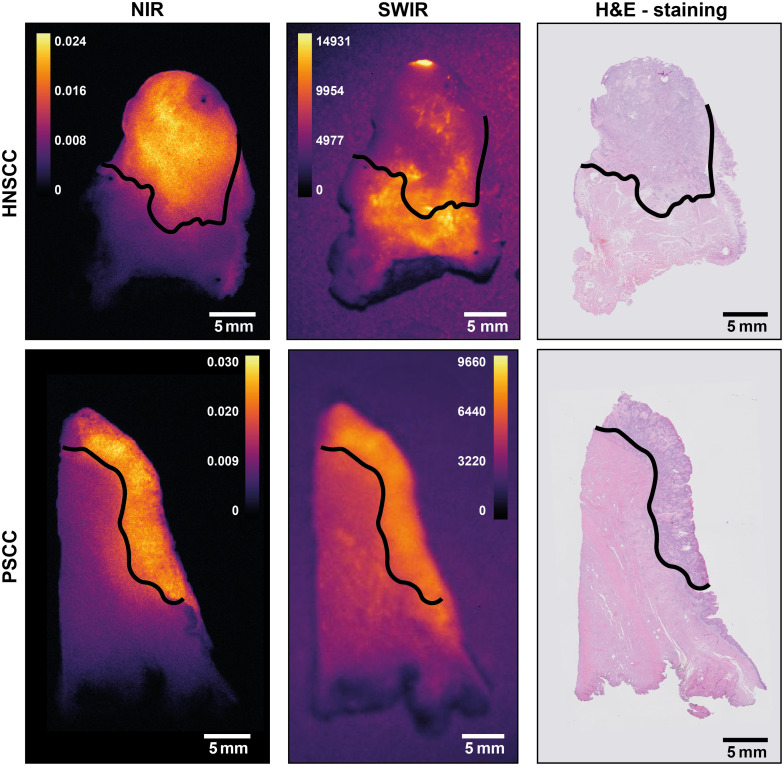
Fig. 9.
Examples of NIR and SWIR fluorescence images for oral (HNSSC) and penile (PSCC) squamous cell carcinoma compared with a hematoxylin and eosin (H&E) staining. The black line represents the tumor boundary, above this line in each image is the tumor, and below is the healthy tissue. Note that for PSCC, NIR and SWIR images indicate the same area, whereas for HNSSC, this is not the case (see text).

