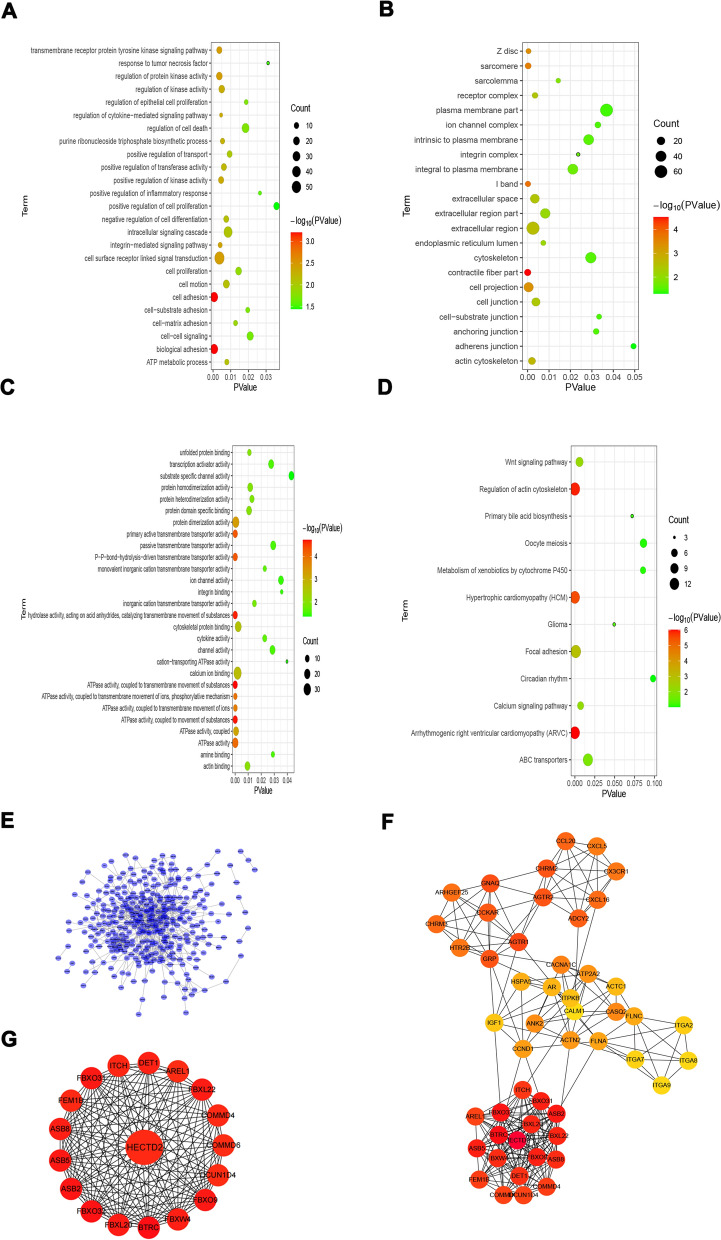
Fig. 1.
Go ontology and KEGG pathway enrichment analyses of the genes in the yellow module. A GO functional (Biological Process, BP) enrichment analyses of genes in the yellow module. B GO functional (Cellular Component, CC) pathway enrichment analyses of genes in the yellow module. C GO functional (Molecular Function, MF) pathway enrichment analyses of genes in the yellow module. D KEGG pathway enrichment analyses of genes in the yellow module. (The –log10 (P-value) of each term is colored according to the legend). E PPI network of genes in yellow module. F Hub network of top 50 hub genes. G The significant sub-module was identified by MCODE

