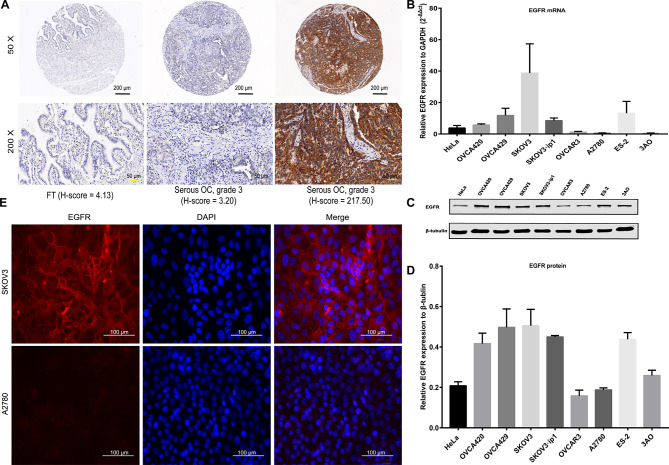
Fig. 3.
EGFR expression in OC tissues and cell lines. (A) IHC staining of EGFR protein in TMAs. FT tissue with a low H-score (4.13); a serous OC tumor (grade 3) with a low H-score (3.20); and a serous OC tumor (grade 3) with a high H-score (217.50). Black scale bar, 200 µm; yellow scale bar, 50 µm. (B) EGFR mRNA expression in OC cell lines was detected by qPCR. (C) WB of EGFR protein in OC cell lines and (D) quantification analyses. (E) IF staining of EGFR in OC SKOV3 cells (positive) and A2780 cells (negative). EGFR, red; DAPI, blue. Magnification 400×; white scale bar, 100 µm. OC: ovarian cancer; IHC: immunohistochemical; TMAs: tissue microarrays; FT: fallopian tube; qPCR: quantitative real-time PCR; WB: western blotting; IF: immunofluorescence; DAPI: 4’,6-diamidino-2-phenylindole

