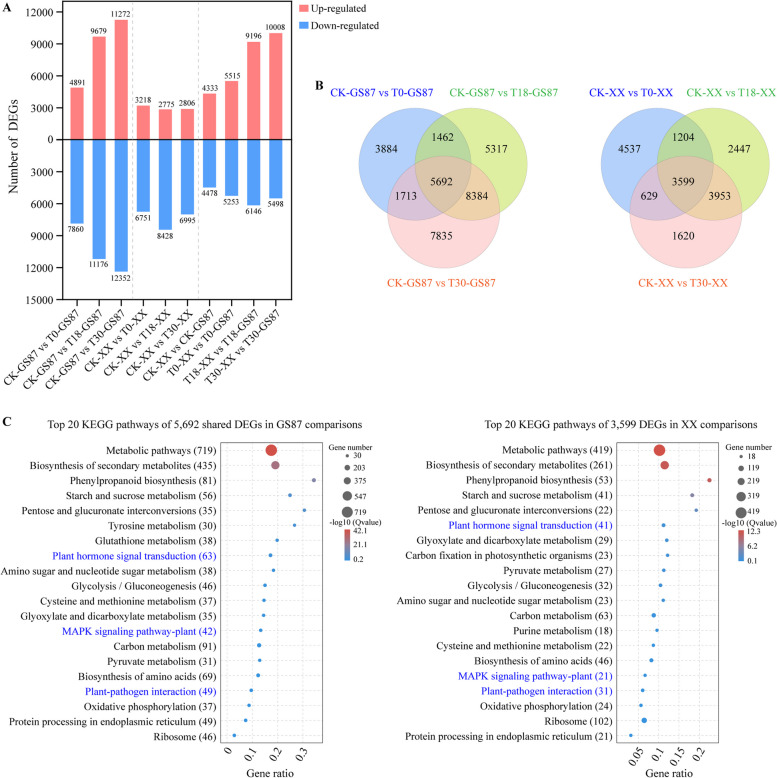
Fig. 3.
Analysis of DEGs between GS87 and XX at different time points. A Distribution of DEGs at different time points. XX samples were used as control groups in the four distinct comparisons. B Venn diagram showing DEGs at 0, 18, and 30 hpi with CK as a control in the same sweetpotato cultivar (left, GS87, right, XX). C Top 20 KEGG pathways enriched by 5,692 common DEGs in the GS87 comparisons (left) and 3,599 common DEGs in the XX comparisons (right). Gene ratio indicated the number of unigenes enriched in specific KEGG pathway divided by the total number of all unigenes annotated in the KEGG database

