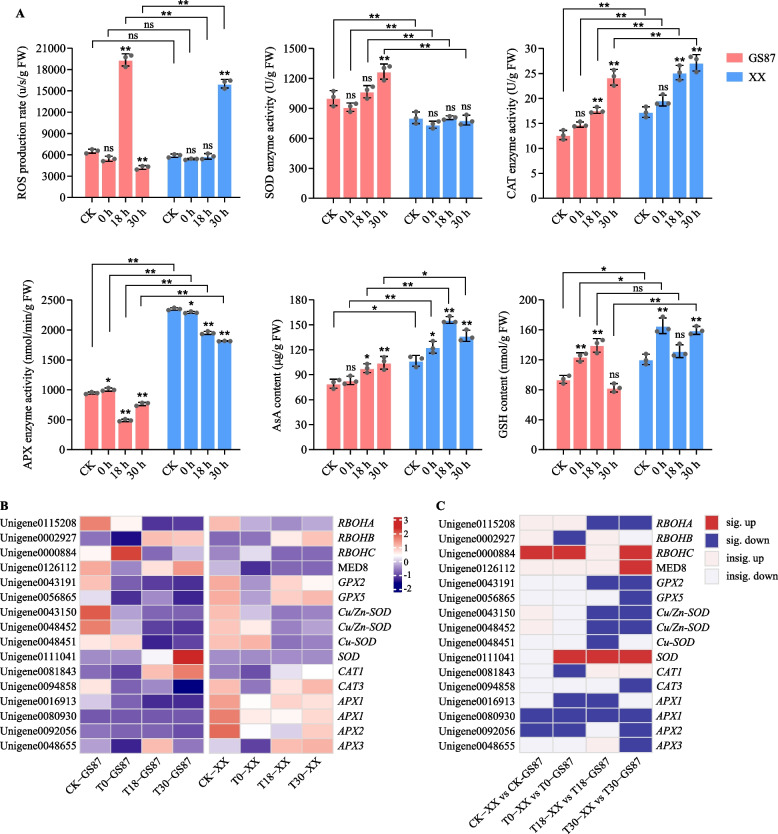
Fig. 6.
Analysis of ROS and the relevant enzymatic and non-enzymatic antioxidants. A Histograms of ROS production rate, enzymes (SOD, CAT, and APX) activity, and non-enzyme (AsA and GSH) content. ROS, reactive oxygen species; SOD, superoxide dismutase; CAT, catalase; APX, ascorbate peroxidase; AsA, ascorbic acid; GSH, glutathione. B Expression patterns of ROS and antioxidants-relevant unigenes in GS87 and XX, respectively. C Unigene expression comparisons between GS87 and XX. Dark red and dark blue rectangles represent significantly up-regulated and down-regulated unigenes with FDR values of < 0.05 between groups. Light red and light blue rectangles represent up-regulated and down-regulated unigenes with FDR values of ≥ 0.05 between groups

