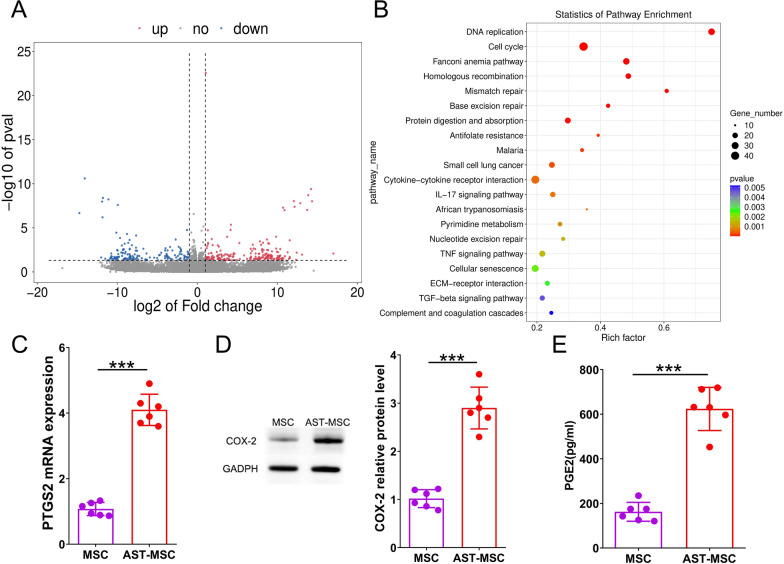
Fig. 2.
Bioinformatics analysis of RNA sequencing performed on MSCs that have been treated with AST. Differentially expressed genes (DEGs) can be shown in a plot called a volcano plot (A). The genes that have been elevated are represented by red dots, while those that have been downregulated are represented by blue dots. The results of KEGG analysis showed that there was a total of 20 signaling pathways that had the highest enrichment (B). Different colors reflect different p values, while different circle sizes represent different gene counts. The relative amounts of PTGS2 mRNA(C) and COX-2 protein (D) in MSCs were determined with the help of RT-PCR and Western blot analysis, respectively. ELISA was utilized to determine the PGE2 content that was present in the supernatant of MSCs(E). (n = 6 per group; student t-test, *p < 0.05, **p < 0.01, ***p < 0.001). Corresponding uncropped full-length gels and blots are presented in Additional file 1

