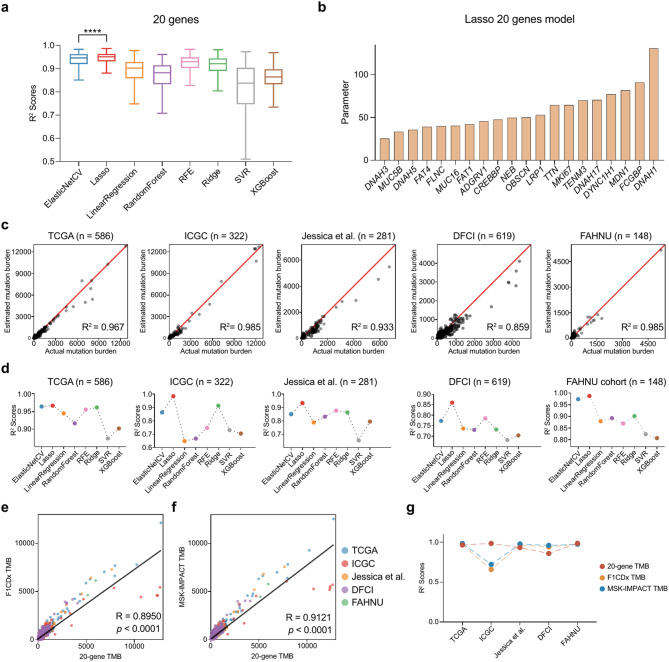
Fig. 3.
20-gene TMB estimation model construction and validation. (a) Box plots illustrate the R2 values of different TMB estimation models when gene number is 20. R2 values—dependent variables; models-independent variables. ****p < 0.0001, the p-value was determined using unpaired t-tests. (b) Genes and corresponding parameters used in the Lasso-based 20-gene TMB estimation model. (c) Lasso-based 20-gene estimated mutation burden versus actual mutation burden validated in TCGA (n = 586), ICGC (n = 322), Jessica et al. (n = 281), DFCI (n = 619) and FAHNU (n = 148) cohorts. Estimated mutation burden—dependent variables; Actual mutation burden-independent variables. (d) Performance of eight TMB estimation models in different CRC cohorts under the condition that the number of genes is set to 20. (e) Scatter plot showing the correlation between 20-gene TMB and F1CDx TMB. (f), Scatter plot showing the correlation between 20-gene TMB and MSK-IMPACT TMB. (g) The line plots illustrate the R2 values of the 20-gene TMB, F1CDx TMB and MSK-IMPACT TMB in the different cohorts

