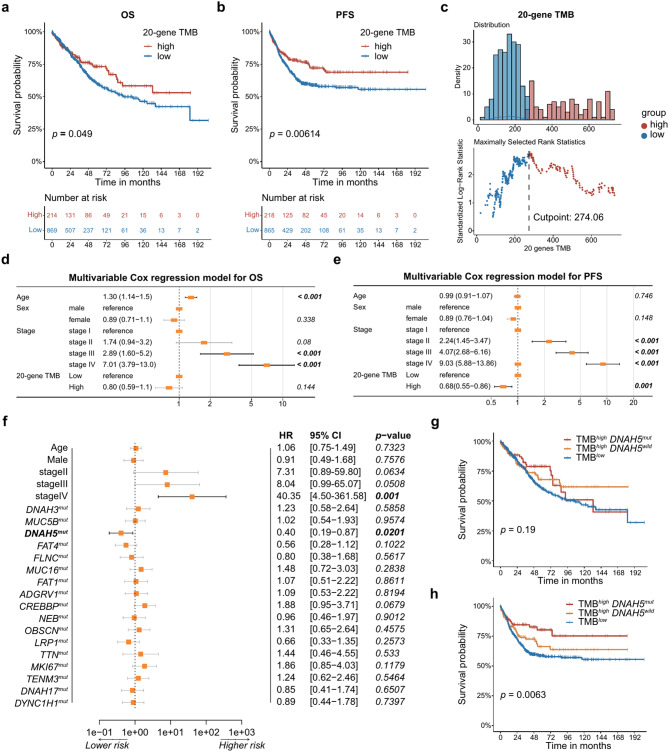
Fig. 4.
20-gene TMB and DNAH5 mutation prognostic role. (a) Kaplan–Meier curves showing the effect of 20-gene TMB on OS in the combined CRC cohort. (b) The effect of 20-gene TMB on PFS in the combined CRC cohort. (c) Density plots of the TMB high-sample and TMB low-sample distributions and the corresponding cut points. (d) Forest plot summarizing prognostic impact of 20-gene TMB on OS by multivariable Cox regression. (e) Forest plot summarizing prognostic impact of 20-gene TMB on PFS by multivariable Cox regression. (f) The forest plot shows the results of multivariable Cox regression in patients with high TMB. (g) OS in groups TMBlow, TMBhigh DNAH5wild and TMBhigh DNAH5mut. (h) PFS in groups TMBlow, TMBhigh DNAH5wild and TMBhigh DNAH5mut

