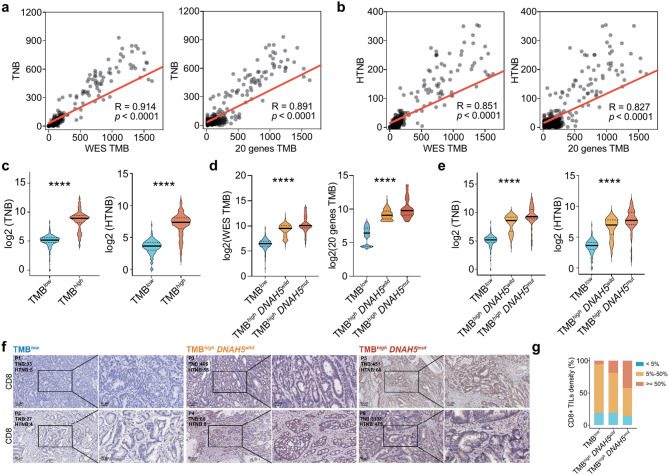
Fig. 6.
20-gene TMB is associated with tumor neoantigen burden. (a) Scatter plot to compute the correlation between WES TMB and TNB (left). Scatter plot summarizing the correlation between 20-gene TMB and TNB (right). (b) Scatter plot of the correlation between WES TMB and HTNB (left). Scatter plot of the correlation between 20-gene TMB and HTNB (right). (c) Comparisons of the TNB and HTNB in groups TMBlow and TMBhigh. Comparisons of the TMB (c), TNB and HTNB (d-e) in group TMBlow, TMBhigh DNAH5wild and TMBhigh DNAH5mut. (f) Immunohistochemistry: IHC staining for CD8 in CRC tissues from TMBlow, TMBhigh DNAH5wild and TMBhigh DNAH5mut groups (scale bar = 50 μm, 200× and 20 μm, 400×). (g) Association of CD8+ TIL density with Different Groupings. Unpaired t-tests were used to determine the significance of the differences between the two groups, and one-way ANOVA was used to determine the significance of the differences between the three groups. ***p < 0.001; ****p < 0.0001

