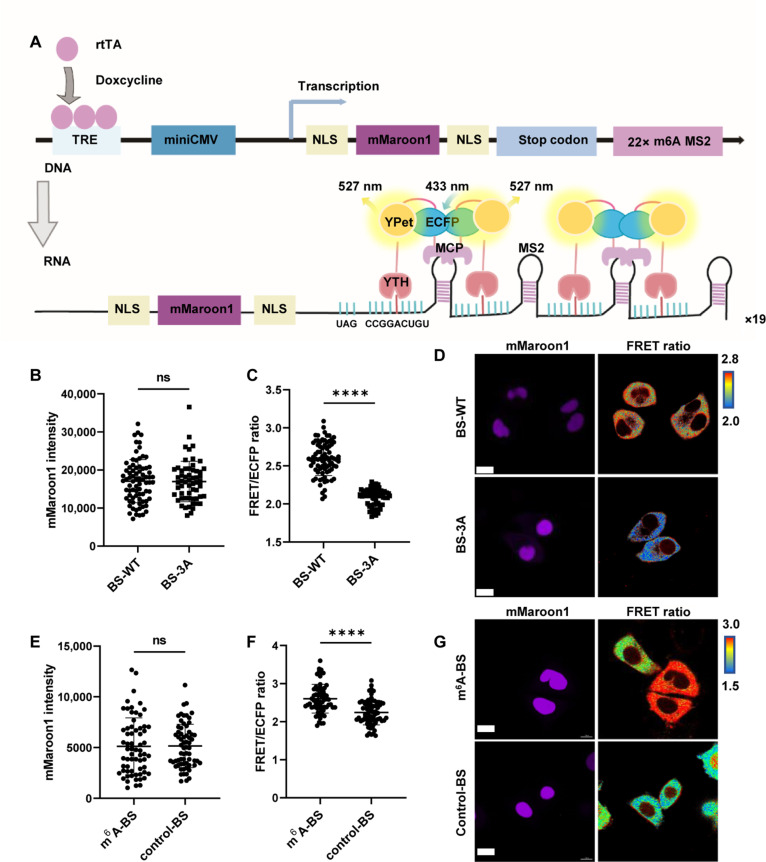
Fig. 2. Live-cell imaging of m6A modifications with high specificity.
(A) Schematic diagram of the live-cell SMIS system based on genetically encoded reporter mRNA and an intramolecular FRET biosensor. (B) mMaroon1 intensity in HeLa cells transiently transfected with the reporter mRNA plasmid and the BS-WT or BS-3A system for 36 hours and then subjected to DOX induction for 12 hours; unpaired t test with Welch’s correction (BS-WT: n = 78; BS-3A: n = 58; P = 0.927). (C) Corresponding FRET/ECFP ratio from (B), unpaired t test with Welch’s correction (BS-WT: n = 78; BS-3A: n = 58; P < 0.0001). (D) Representative images of mMaroon1 and the FRET/ECFP ratio for (B) and (C). Scale bar, 15 μm. (E) mMaroon1 intensity in HeLa cells transiently transfected with BS-WT and m6A reporter (GGACU motif) or control reporter (GGTCU motif) for 36 hours and subjected to DOX induction for 12 hours, unpaired t test with Welch’s correction (n = 65, P = 0.9416). (F) Corresponding FRET/ECFP ratio from (E), unpaired t test with Welch’s correction (n = 65, P < 0.0001). (G) Representative images of mMaroon1 and the FRET/ECFP ratio for (E) and (F). Scale bar, 15 μm. ns, not significant.

