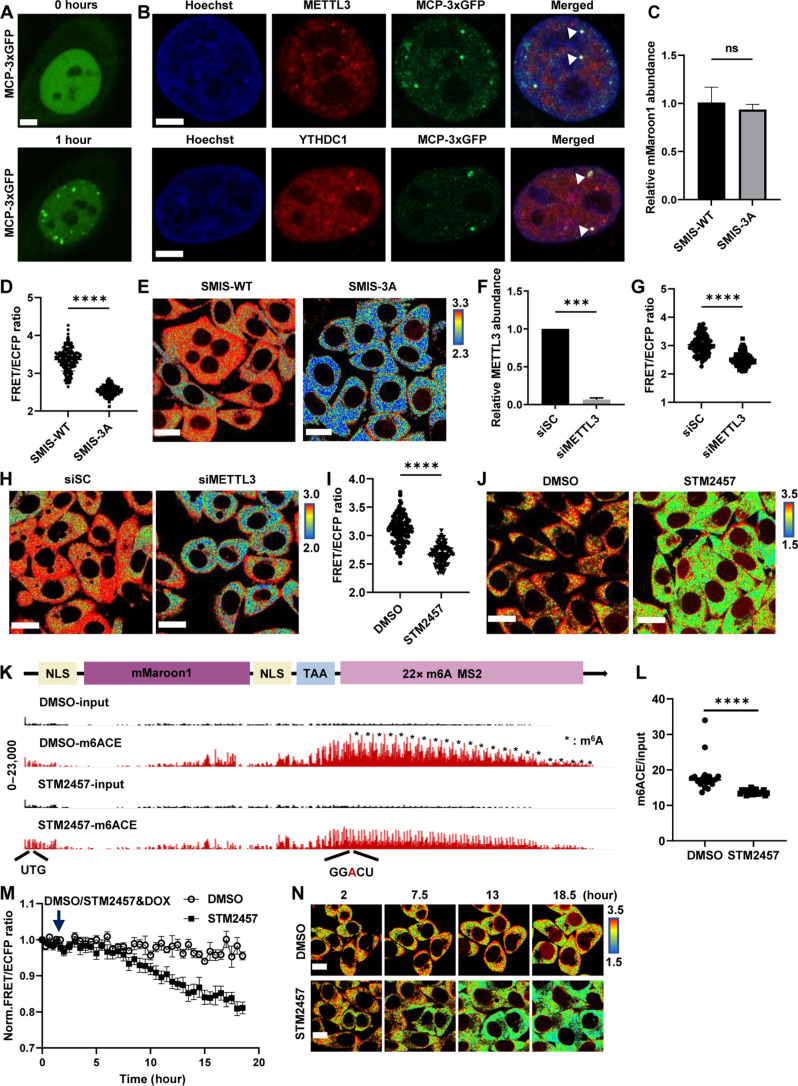
Fig. 3. SMIS detects the changes of m6A modification responsive to METTL3 regulation.
(A) MCP-3×GFP images of m6A reporter cell after transient transfection with MCP-3×GFP for 36 hours and DOX induction for 1 hour. Scale bar, 5 μm. (B) Immunostaining for METTL3 and YTHDC1 of m6A reporter cells in (A). Scale bars, 5 μm. (C to E) Relative abundance of the mMaroon1 mRNA, quantification of FRET ratio, and representative images of FRET ratio in SMIS-WT and SMIS-3A cells after DOX induction for 12 hours. Unpaired t test with Welch’s correction [n = 3, P = 0.5168 in (C); n = 150, P < 0.0001 in (D)]. Scale bars, 20 μm. (F) Relative METTL3 RNA abundance in HeLa cells after siSC or siMETTL3 treatment for 48 hours. Unpaired t test with Welch’s correction (n = 3, P = 0.0002). (G and H) Quantification of FRET ratio and representative images of FRET ratio of SMIS-WT after siSC or siMETTL3 treatment for 36 hours and DOX induction for 12 hours. Unpaired t test with Welch’s correction (n = 100, P < 0.0001). Scale bars, 20 μm. (I and J) Quantification of FRET ratio and representative images of FRET ratio in SMIS-WT cells after pretreatment with DMSO or STM2457 for 3 hours and incubated with DMSO or STM2457 (60 μM) and DOX (1 μg/ml) for 12 hours. Unpaired t test with Welch’s correction (n = 100, P < 0.0001). Scale bars, 20 μm. (K) m6ACE (red) and input (black) read-start counts [in reads per million mapped (RPM)] mapped to mMaroon1 reporter gene in (J); * means m6A site on reporter mRNA. (L) Quantification of m6ACE/input ratio at m6A site of reporter mRNA from (K). Unpaired t test with Welch’s correction (n = 22, P < 0.0001). (M) Time-course FRET imaging of SMIS-WT after DMSO/STM2457 treatment, n = 10, specifically. (N) Representative FRET images in (M). Scale bars, 10 μm.

