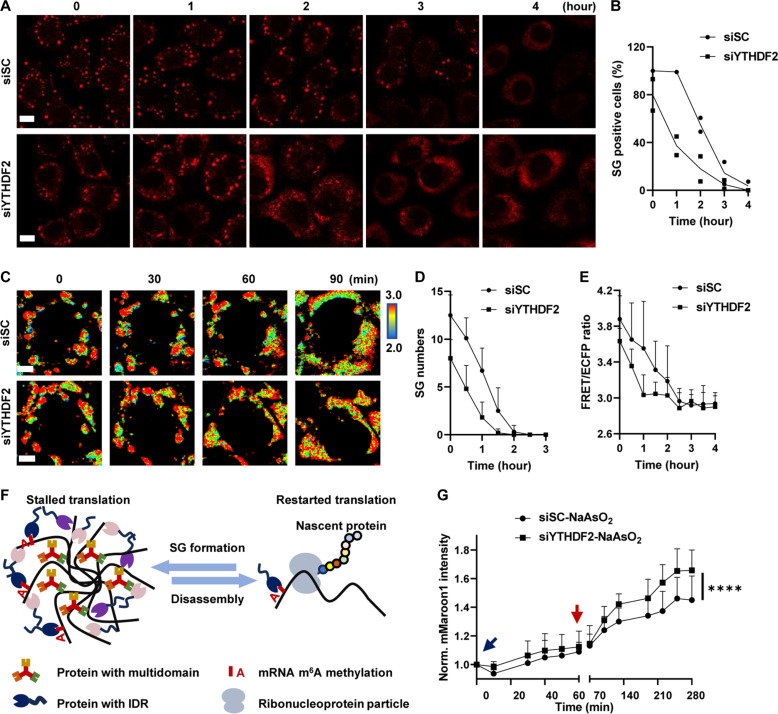
Fig. 6. YTHDF2 regulates SG stability and function.
(A) G3BP1 immunostaining of HeLa cells after NaAsO2 removal. HeLa cells were treated with siSC or siYTHDF2 for 48 hours, NaAsO2 for 1 hour, and fresh medium supplemented with siRNA for the indicated times. Scale bars, 10 μm. (B) Percentage of SG-positive HeLa cells after NaAsO2 removal. n = 2. (C) Representative images of the FRET ratio of SMIS-WT after siSC or siYTHDF2 treatment for 36 hours, DOX induction for 12 hours, NaAsO2 treatment for 1 hour, and recovery by removal of NaAsO2. Scale bars, 5 μm. (D) SG numbers in SG-positive SMIS-WT cells after NaAsO2 removal from (C). n = 8. (E) Quantification of FRET ratio during SG disassembly in SMIS-WT cells after NaAsO2 removal from (C). Granules were manually segmented and circled to quantify their average FRET/ECFP ratio at t = 0. As time went by, the average FRET/ECFP ratio in those circled regions were calculated continually regardless of whether granules were present or not. n = 8. (F) Relationships between translation and SG dynamics. (G) Normalized mMaroon1 intensity in SMIS-WT cells after siRNA treatment during SG formation and disassembly. Unpaired t test with Welch’s correction (n = 30, P < 0.0001).

