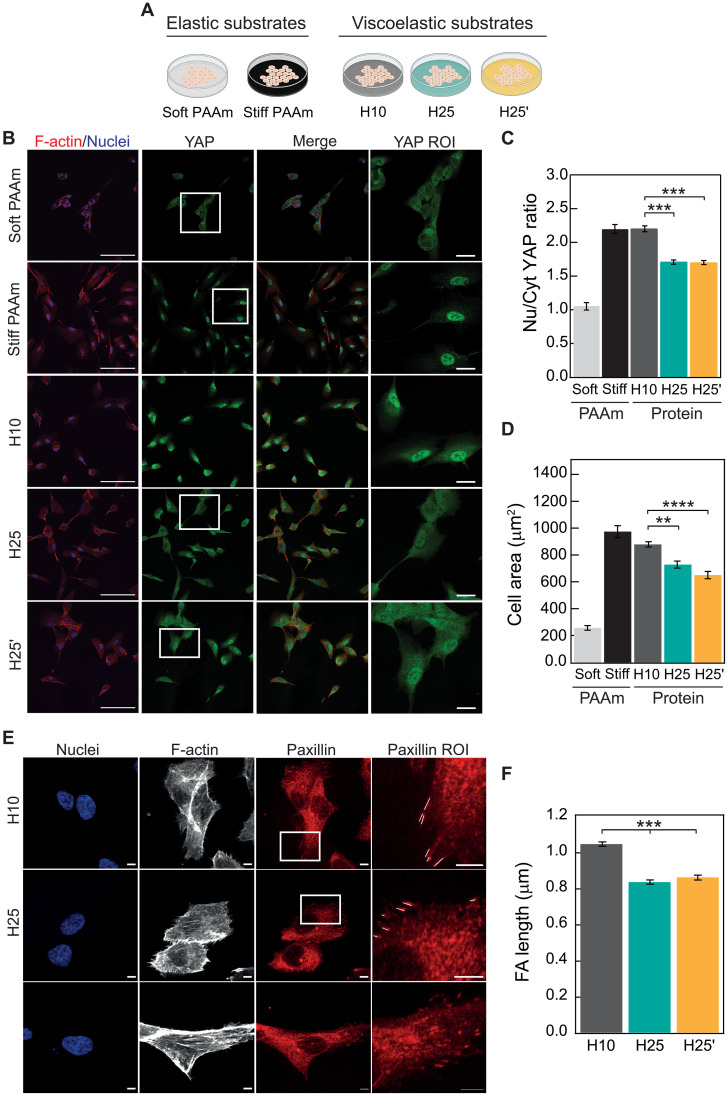
Fig. 2. Blunted mechanosensing in cells grown on rigid viscoelastic substrates.
(A) Outline of experimental conditions. (B) Confocal immunofluorescence images of YAP localization in RPE-1 cells grown on elastic stiff or soft PAAm or on H10, H25, or H25′ protein matrices. F-actin was stained with Alexa Fluor 647-conjugated phalloidin (red; first column), and nuclei were stained with 4′,6-diamidino-2-phenylindole (DAPI; blue in merged images; first and third columns). YAP was labeled with Alexa-Fluor-488-conjugated antibody in green (second column). The fourth column shows zoomed views of the YAP region of interest (ROI) (boxed in white in the YAP column). Scale bars, 100 μm (first to third columns) and 20 μm (fourth column). (C) Quantification of nuclear versus cytoplasmic YAP distribution. (D) Cell spreading quantified as cell area. A minimum of n = 30 cells per condition were quantified in a total of four independent experiments. (E) Confocal immunofluorescence images of focal adhesions in RPE-1 cells grown on H10, H25, or H25′ matrices. Nuclei were stained with DAPI (first column), and F-actin was stained with Alexa-Fluor-647-conjugated phalloidin (second column). Paxillin in focal adhesions was labeled with Alexa-Fluor-568-conjugated antibody in red (third column). The fourth column shows zoomed views of the paxillin ROI (boxed in white in the paxillin column; focal adhesions are marked with white lines). Scale bars, 5 μm. (F) Focal adhesion (FA) length quantification. A minimum of n = 30 cells per condition were quantified in a total of three independent experiments. PAAm groups are not considered for statistical analysis in (C) and (D). Data are presented as mean ± SEM, ordinary one-way analysis of variance (ANOVA); **P < 0.01, ***P < 0.001, and ****P < 0.0001.

