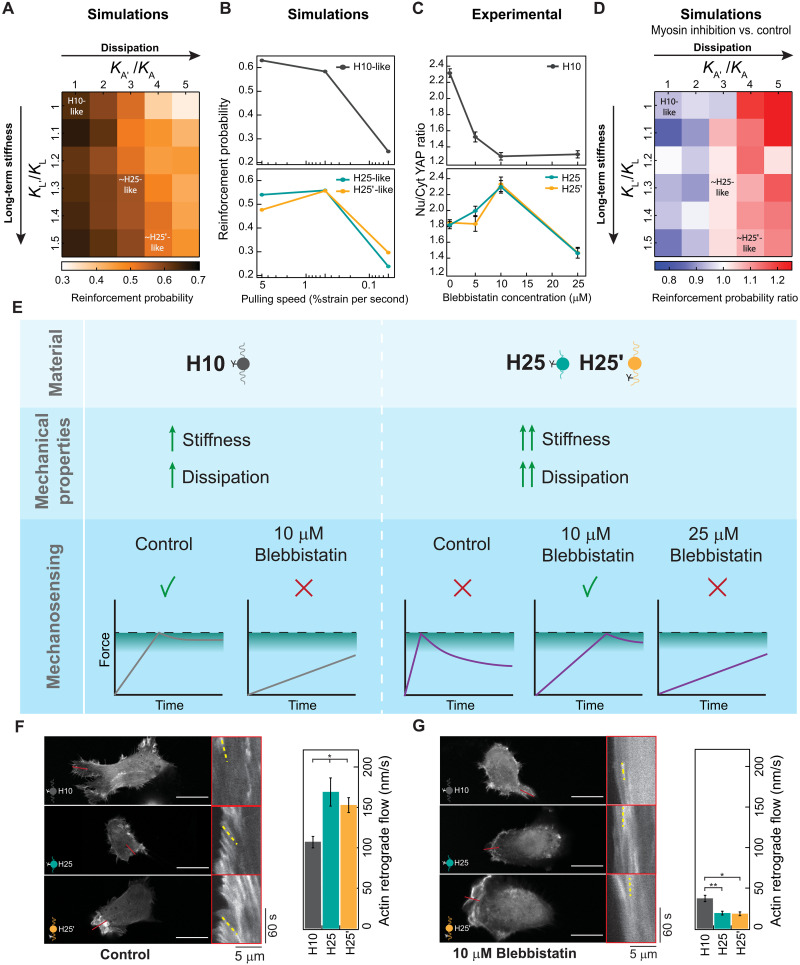
Fig. 6. The pull-and-hold molecular clutch model reproduces cell mechanosensing of protein viscoelastic matrices.
(A) Simulated reinforcement probability in different stiff viscoelastic substrates considering H10-like parameters as reference. Position of parameters similar to H25/H25′ materials is indicated. (B) Dependency of simulated reinforcement probability with cell pulling speed for H10-like and H25-like substrates. (C) Nuclear versus cytoplasmic YAP in cells seeded on H10, H25, or H25′ substrates and treated with increasing concentrations of blebbistatin. Data are obtained from three specimens of H10, H25, and H25′ hydrogels produced in independent cross-linking reactions from two protein purification batches. (D) Reinforcement probability ratio obtained by comparing simulations at pulling speeds of 0.5 (representing myosin inhibition) and 5 (representing control conditions) %strain per second. H10-like parameters are used as a reference and position of parameters similar to H25/H25′ materials are indicated. (E) Interpretation of cell mechanosensing in different viscoelastic substrates and under different degrees of myosin inhibition according to the pull-and-hold model. (F and G) Actin retrograde flow of cells seeded on H10, H25, or H25′ matrices in control (F) and in the presence of 10 μM blebbistatin (G). Representative static images are shown on the left of the panels, and kymographs on red boxes show actin movement toward the cell center measured in regions of interest indicated by red lines. Representative actin trajectories are highlighted in yellow. At least 30 measurements per condition were used to quantify actin retrograde flow (right). Scale bars, 20 μm. Data are presented as mean ± SEM, ordinary one-way ANOVA; *P < 0.05 and **P < 0.01.

