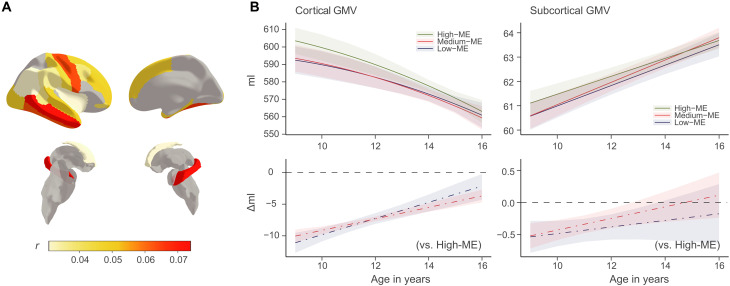
Fig. 1. The influence of ME on regional GMVs.
(A) Spearman correlations between ME and regional GMVs, adjusting for age, site, handedness, sex, and estimated intracranial volume. Regions in gray indicate nonsignificant correlations after BH-FDR correction. (B) Longitudinal effects of ME on cortical (left) and subcortical brain GMVs. Both GMVs (top) and GMV change rate (bottom) for participants with high, medium, and low levels of ME are estimated. The bands indicate 95% confidence intervals for predicted GMV at the top and relative regression coefficients at the bottom.

