
Figure 2.
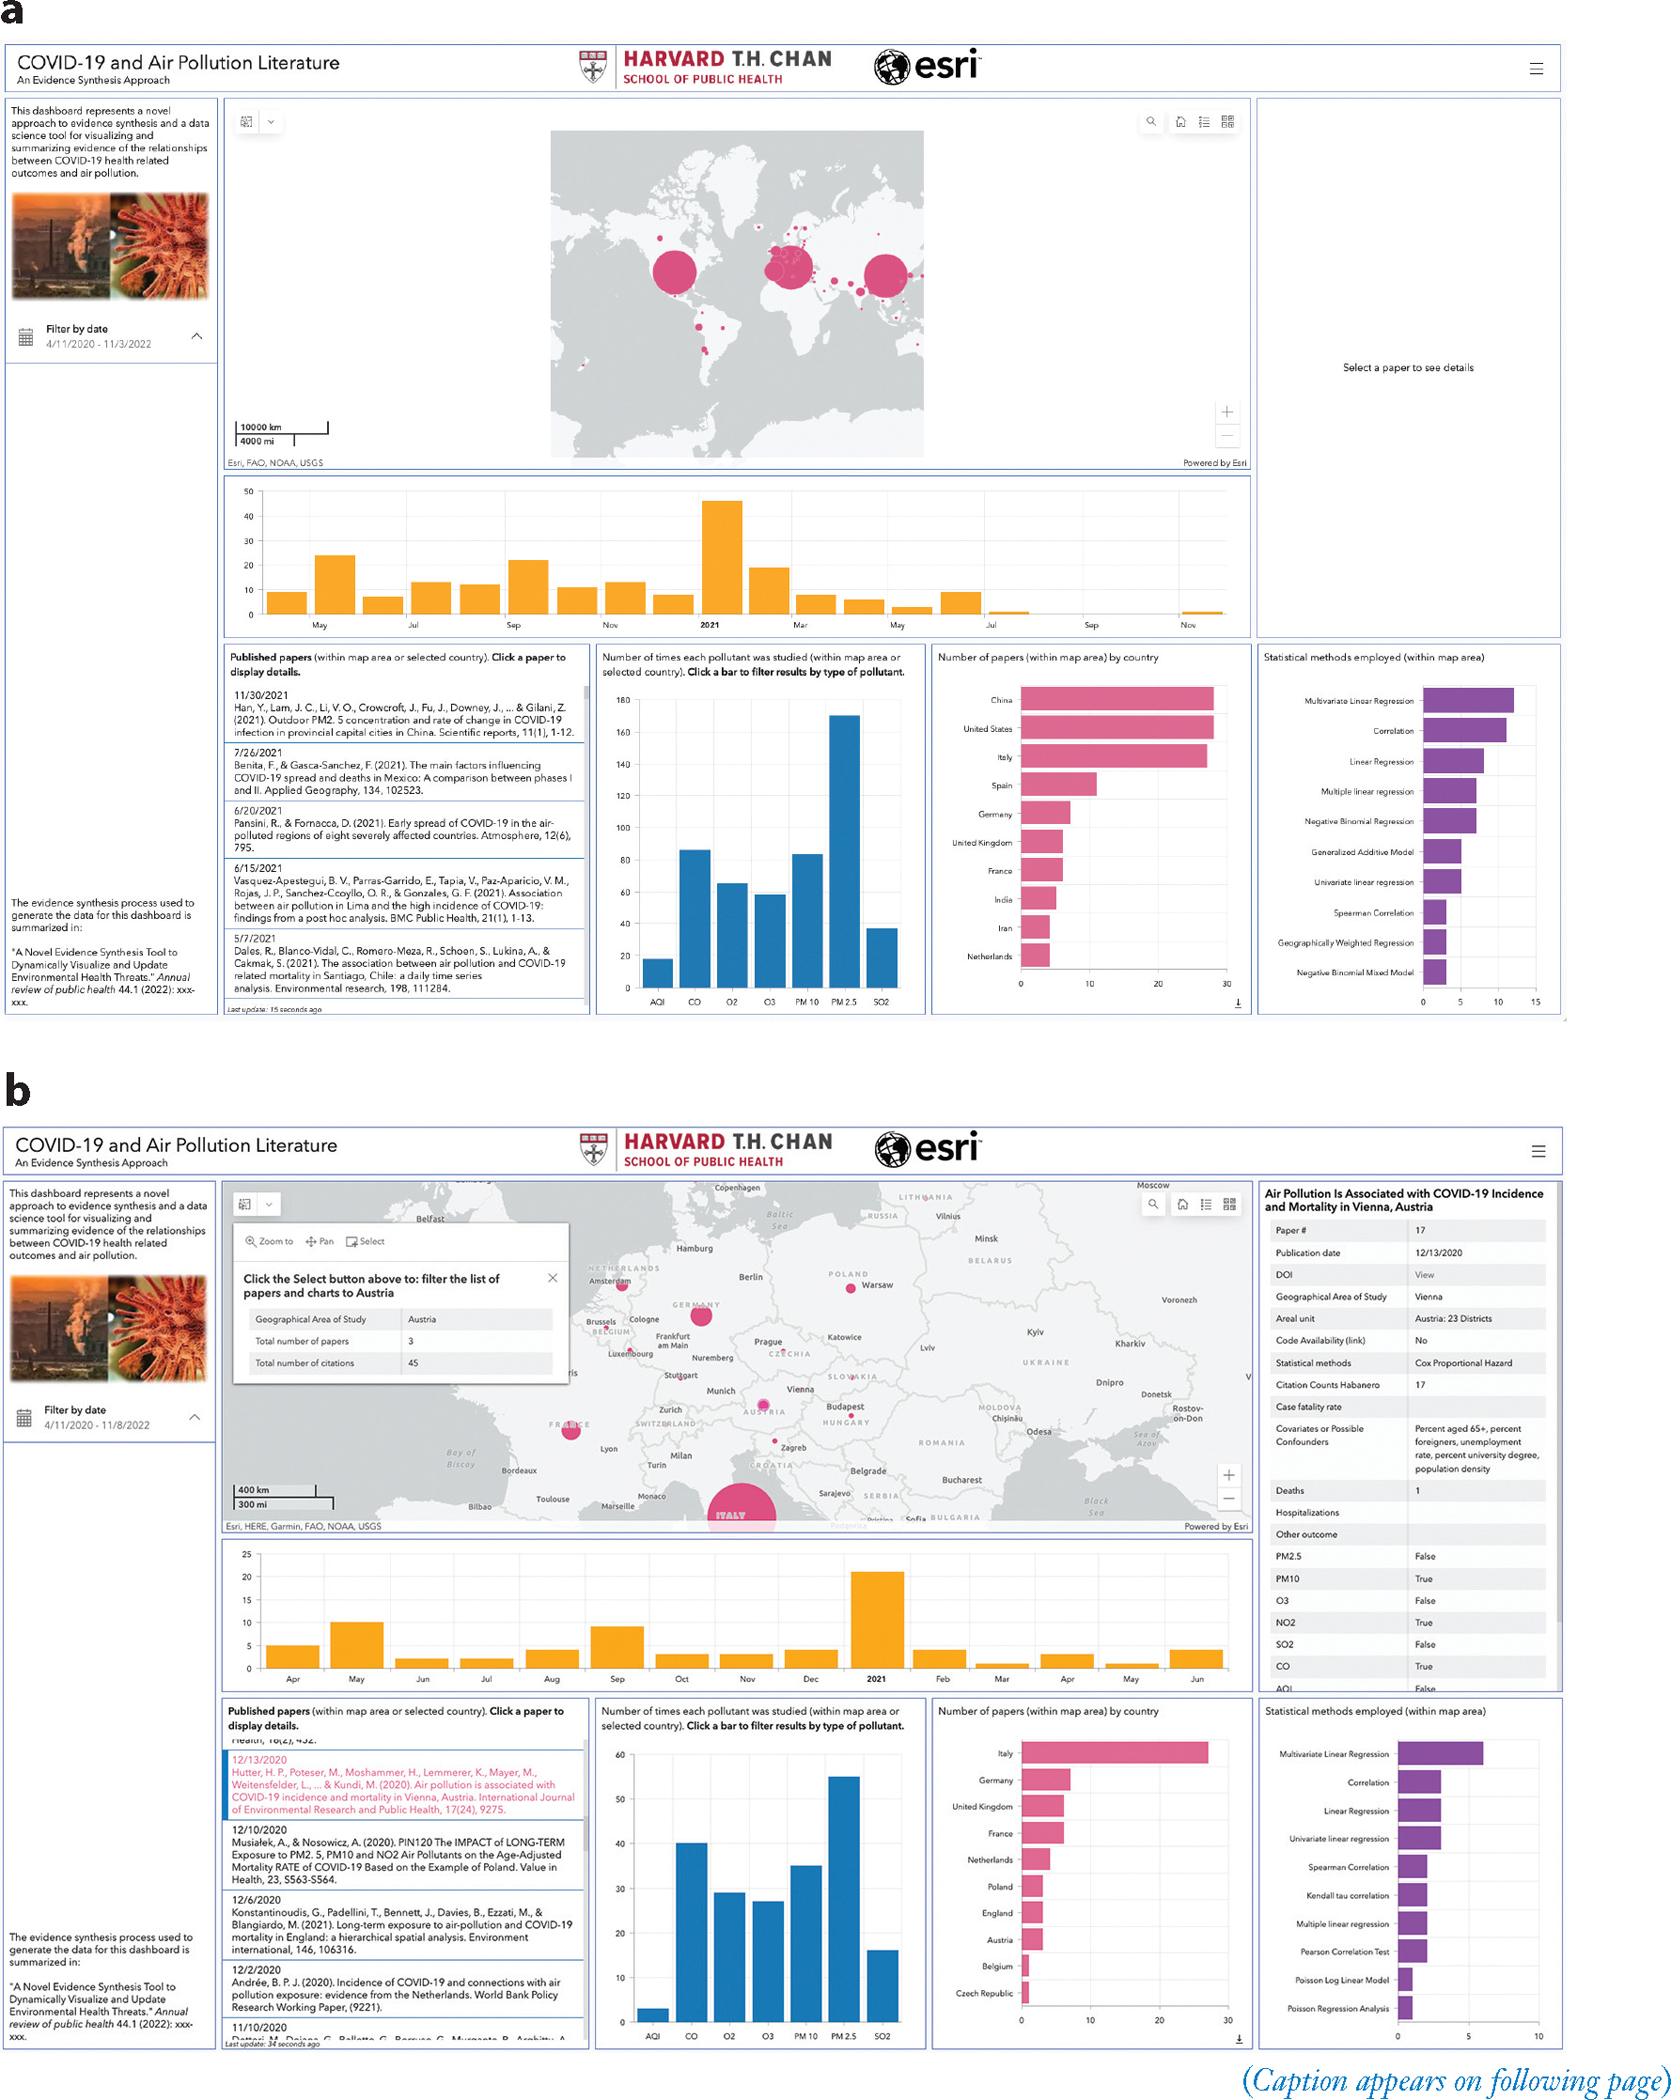
(Figure appears on preceding page) Screenshots of the evidence synthesis tool dashboard (http://bit.ly/3hzcsbv). (a) Zoomed out dashboard containing information from most countries, including the three most studied countries (Italy, China, United States). (b) Zoomed into Central Europe. The air pollutant types, papers within each country, and statistical methods chart have changed accordingly. In addition, the Austria graduated circle and a specific paper from Austria have been selected and the associated text is displayed. The short video demonstrating the capabilities of the dashboard is available at https://vimeo.com/709361095.