Figure 3.
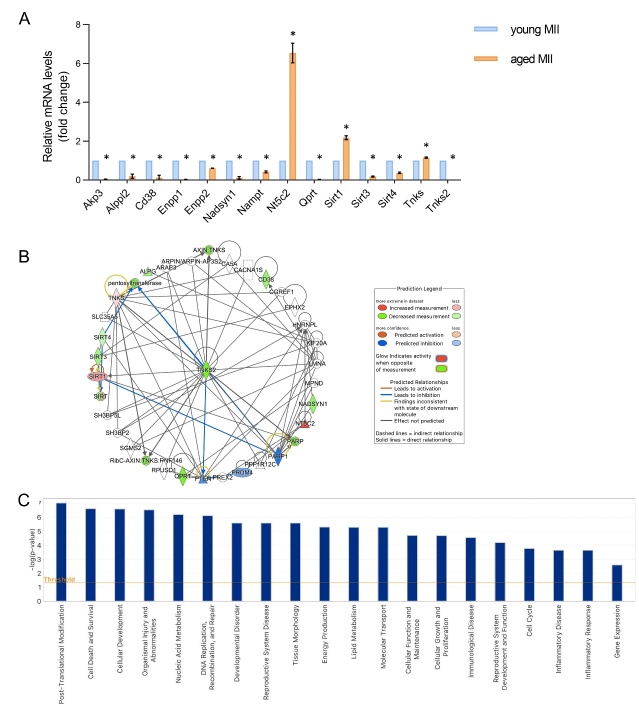
Differentially expressed genes involved in NAD+ metabolism in young and aged MII oocytes and Ingenuity pathway analysis (IPA)-generated functional analysis. (A) Histograms of significant mean fold change values for all differentially expressed genes in physiological aged oocytes compared to young controls. Pools of 25 oocytes isolated from 3-6 mice were employed. The experiment was repeated three times. Statistical analysis by paired t-test: *p<0.05. (B) IPA-interfered target gene network for NAD+ metabolism of physiologically aged MII oocytes compared to controls. Tnks2 gene is the central node of IPA-interfered target gene network for NAD+ metabolism of physiologically aged oocytes in comparison to young oocytes. In red the up-regulated genes, while in green the down-regulated ones. Blue arrow lines indicate a predicted inhibition. (C) The bar-chart is generated based on a -log (p-value) threshold of 0.05 and indicates the main significant biological functions regulated by our gene dataset in aged oocytes.

