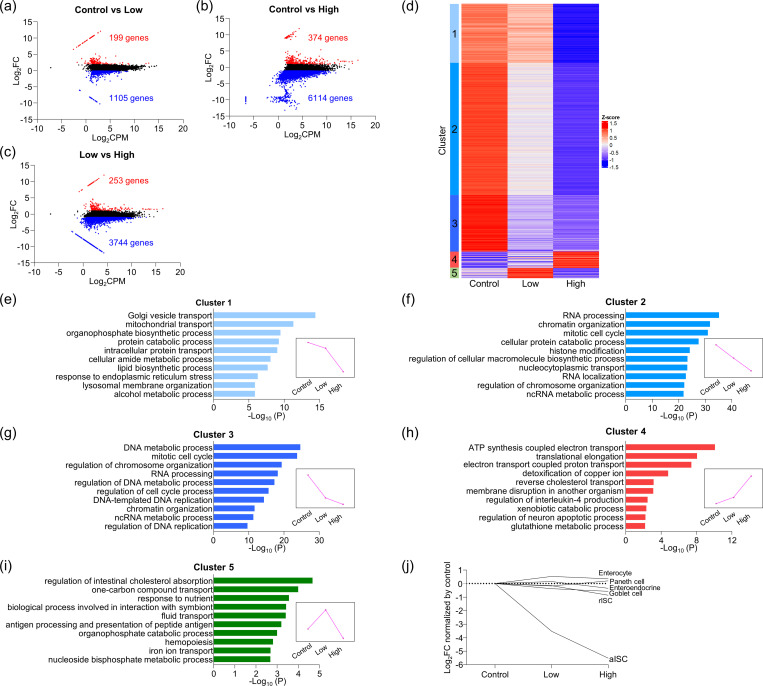
Fig 1. Transcriptome profiling of light-illuminated enteroids.
(a–c) MA-plot showing DEGs in light-illuminated enteroids between control, low-dose light illumination, and high-dose light illumination. (d) Gene expression profiling among each light illumination condition by k-means clustering analysis (k = 5, 1000 repetitions). Heatmap represents up- and downregulated genes within five clusters for individual experimental samples. (e)–(i) GO enrichment analysis result of genes in each cluster. The GO terms from biological process within the top 10 accumulative hypergeometric p-values were represented. All GO terms significantly enriched (p < 0.01) were listed in S1 Table. Magenta line graphs represent variation patterns of mean gene expression under light illumination in each cluster. (j) mRNA expression of major cell lineage markers (aISC: Olfm4, rISC: mTert, enterocyte: Alpi, enteroendocrine: Sct, goblet cell: Muc2, Paneth cell: Defa3) of light-illuminated enteroids.

