ABSTRACT
Introduction:
This study aimed to evaluate the usefulness of machine learning (ML) and neural network (NN) models versus traditional statistical methods for estimating biochemical recurrence (BCR) in men following robot-assisted radical prostatectomy (RARP).
Methods:
Patients who underwent RARP from November 2011 to July 2022 were taken in the study. Patients with BCR were assigned to Group 2, whereas those without BCR were placed in Group 1. Preoperative and postoperative parameters, together with demographic data, were recorded in the database. This study used one NN, the radial basis function NN (RBFNN), and two ML approaches, the K-nearest neighbor and XGboost ML models, to predict BCR.
Results:
Following the application of exclusion criteria, 516 patients were deemed eligible for the study. Of those, 234 (45.3%) developed BCR, and 282 (54.7%) did not. The results showed that the median follow-up period was 24 (15–42) months, and the median BCR diagnosis was 12.23 ± 15.58 months. The area under the curve (AUC) for the Cox proportional hazard analysis was 0.77. The receiver-operating characteristic curves (AUCs) for the XGBoost and K closest neighbor models were 0.82 and 0.69, respectively. The RBFNN’s AUC was 0.82.
Conclusions:
The classical statistical model was outperformed by XGBoost and RBFNN models in predicting BCR.
INTRODUCTION
Artificial intelligence (AI) includes machine learning (ML) and neural networks (NNs). The collected patient data may have intricate linkages and patterns that traditional statistical approaches are unable to uncover, particularly when working with large databases. AI can make it possible to design innovative and intuitive algorithms.[1]
Among men’s cancers, prostate cancer (PCa) is the second-most common cause of death.[2] Biochemical recurrence (BCR) is diagnosed in 27% of the patients and is associated with metastasis and mortality in patients after radical prostatectomy (RP).[3] Most of these recurrences occur during the initial 2 years after RP.[3,4] Evidence indicates that timely identification of patients at greater risk for BCR and prompt diagnosis and treatment of BCR result in the customization of patient care approaches, improved oncological outcomes, and enhanced prognostic estimate.[5] Furthermore, it is imperative to identify patients who possess a lower risk for BCR to safeguard them from the adverse consequences associated with additional treatments.[5]
The Cancer of the Prostate Risk Assessment and Kattan nomogram were devised as predictive models for estimating BCR in prostate cancer patients. These models are widely utilized in clinical settings.[6,7] However, classical statistical techniques have their limitations. This work aimed to compare the ML and NN models with the classical statistical model for estimating BCR in patients by utilizing clinical factors, ML, and NN techniques.
MATERIALS AND METHODS
Patients
The prospectively collected data of the patients who underwent RP between November 2011 and May 2022 were retrospectively reviewed. Patients who received preoperative radiotherapy, bacterial infection, distant metastasis or suspicion of distant metastasis, incomplete data, and a follow-up of <1 year were excluded from the study.
All patients underwent robot-assisted RP (RARP) at least 4 weeks after the last transrectal ultrasound (TRUS)-guided prostatic biopsy. Preoperative blood tests were done, and patients were risk-stratified using the National Comprehensive Cancer Network (NCCN) criteria. A multiparametric magnetic resonance imaging (MRI) was performed. The surgery was performed using the Da Vinci Si or Xi system.[7] A bilateral nerve-sparing approach was used where feasible, and bilateral pelvic lymph node dissection was performed.
Data collection
The demographic information and pre- and post-operative parameters were documented. The histological examination of TRUS-guided prostate biopsy tissues was reported using the Gleason grading system. Patients underwent clinical and pathological staging following established protocols. The classification of tumor-node-metastasis was used for the clinical stage. The risk stratification was done according to NCCN guidelines. The term “positive surgical margin” refers to identifying a tumor at the inked boundary during a histopathological examination. Operationally, the BCR was defined as a serum prostate-specific antigen (PSA) level more than 0.2 ng/mL on two separate measurements taken after RP.
Statistical methods
This study’s categorical data were represented using numerical values and percentages. The means and standard deviations were computed for continuous variables. The means of two groups that follow a normal distribution were compared using Student’s t-test. The Mann–Whitney U-test was employed to compare the means of groups that were not normally distributed. We used two statistical tests to analyze the data: Pearson’s Chi-square test and Fisher’s exact test. These tests were utilized to assess the significance of any differences observed in the frequencies of the categorical variables under investigation. The P values below the threshold of 0.05 were considered statistically significant.
The study employed univariable and multivariable regression analyses using Cox proportional hazard regression analysis to determine the BCR. K-nearest neighbor (KNN) and XGboost ML models were generated to predict BCR. KNN finds the sample’s closest neighbors and classifies the samples based on their proximity. XGBoost is an extreme gradient-boosting algorithm. It used iterative ML called gradient boosting. It creates decision trees in a sequential fashion, with each tree fixing the mistakes of the one before it. Then, we used a radial basis function NN (RBFNN) to predict BCR. RBFNN can effectively capture intricate linkages within the data. We split the dataset into training data (70%) and testing data (30%). Accuracy and receiver-operating characteristic (ROC) curve analysis was conducted to evaluate the model’s predictive capability. The statistical analysis was performed using Statistical Product and Service Solutions (SPSS Inc., Chicago, IL, USA version 23.0 for Windows) and RStudio Team (2020). RStudio: Integrated Development for R. RStudio, PBC, Boston, MA, USA.
RESULTS
Patient characteristics
After 916 patients’ data were evaluated and the exclusion criteria were applied, 516 patients were deemed eligible for the study. Of those, 234 (45.3%) developed BCR, and 282 (54.7%) did not. Table 1 provides the demographic, preoperative, intraoperative, and postoperative data. The results showed that the median follow-up period was 24 (15–42) months, and the median BCR diagnosis was made at 12.23 ± 15.58 months.
Table 1.
The demographic data, preoperative, intraoperative, and postoperative data of patients with and without biochemical recurrence
| Parameter | Overall (n=516), n (%) | BCR present (n=234; 45.3%), n (%) | BCR absent (n=282; 54.6%), n (%) | P |
|---|---|---|---|---|
| Age | 66 (30–83) | 66 (45–83) | 64 (30–78) | 0.28 |
| Mean BMI | 26.6±4.2 | 26.4±4.6 | 26.4±7.3 | 0.31 |
| Hypertension | 331 (64.14) | 149 (63.7) | 182 (64.5) | 0.83 |
| Diabetes mellitus | 156 (30.23) | 79 (33.8) | 77 (27.3) | 0.11 |
| Other comorbidities | 86 (35.09) | 38 (16.2) | 48 (17) | 0.39 |
| Previous history of TURP | 23 (4) | 10 (4.3) | 13 (4.6) | 0.85 |
| Charlson comorbidity index | 4 (2–10) | 5 (2–10) | 4 (2–10) | |
| Mean preoperative PSA | 21.6±25 | 29.3±32.1 | 15.2±14.3 | <0.001 |
| Clinical stage | ||||
| cT1b | 11 (2) | 5 (2.1) | 6 (2.1) | <0.001 |
| cT1c | 210 (40.6) | 68 (29) | 142 (50.4) | |
| cT2a | 71 (13.7) | 36 (15.3) | 35 (12.4) | |
| cT2b | 121 (23.4) | 69 (29.4) | 52 (18.4) | |
| cT2c | 88 (17) | 51 (21.7) | 37 (13.1) | |
| cT3 | 3 (0.5) | 3 (1.3) | 0 | |
| NCCN risk groups | ||||
| Very low | 8 (1.5) | 0 | 8 (2.8) | <0.001 |
| Low | 38 (7.3) | 8.(3.4) | 30 (10.7) | |
| Favorable intermediate | 96 (18.6) | 21 (8.9) | 75 (26.7) | |
| Unfavorable intermediate | 109 (21.12) | 34 (14.5) | 75 (26.7) | |
| High | 238 (46.12) | 152 (64.9) | 86 (30.6) | |
| Very high | 26 (5) | 26 (11.1) | 7 (2.5) | |
| MRI staging | ||||
| Organ confined | 360 (69.7) | 135 (57.5) | 225 (80.1) | <0.001 |
| Extraprostatic extension | 75 (14.5) | 40 (17.1) | 35 (12.5) | |
| Seminal vesicle involvement | 52 (10) | 37 (15.8) | 15 (5.3) | |
| LN enlargement >1 cm | 20 (3.8) | 15 (6.4) | 5 (1.8) | |
| TRUS biopsy Gleason grade group | 2 (1–5) | 3 (1–5) | 2 (1–5) | <0.001 |
| Mean maximum core involvement (%) | 60.4±35.4 | 57.2±32.4 | 54.9±41.2 | 0.04 |
| Lymphadenectomy | ||||
| Not done | 23 (4.4) | 5 (2.1) | 18 (6.4) | <0.001 |
| Standard PLND | 463 (89.7) | 224 (95.7) | 239 (84.8) | |
| Extended PLND | 30 (5.8) | 5 (2.1) | 25 (8.9) | |
| Nerve-sparing | ||||
| None | 130 (25.2) | 83 (35.5) | 47 (16.7) | <0.001 |
| Partial sparing | 282 (54.6) | 115 (49.1) | 167 (59.4) | |
| B/L standard nerve-sparing | 101 (19.5) | 35 (15) | 66 (23.5) | |
| Mean tumor volume in final biopsy (%) | 28.85±20.07 | 37.20±23.08 | 21.3±13.1 | <0.001 |
| Number of positive LN | 0 (0–15) | 0 (0–15) | 0 (0–12) | 0.03 |
| Number of LN removed | 17 (1–64) | 17 (12–23) | 17 (1–40) | 0.02 |
| ISUP pathological grade | ||||
| 1 | 68 (13.1) | 9 (3.8) | 59 (20.9) | <0.001 |
| 2 | 179 (34.6) | 53 (22.6) | 126 (44.7) | |
| 3 | 111 (21.5) | 58 (24.8) | 53 (18.8) | |
| 4 | 110 (21.3) | 75 (32.1) | 35 (12.4) | |
| 5 | 46 (8.9) | 39 (16.7) | 7 (2.5) | |
| Extracapsular extension in LN | 18 (3.4) | 15 (6.4) | 3 (1) | 0.004 |
| Pathological stage | ||||
| T2a | 103 (19.9) | 18 (7.7) | 88 (31.2) | <0.001 |
| T2b | 2 (0.3) | 1 (0.4) | 1 (0.4) | |
| T2c | 91 (17.6) | 26 (11.1) | 65 (23) | |
| T3a | 140 (27.1) | 65 (27.8) | 75 (26.6) | |
| T3b | 177 (34.3) | 124 (53) | 53 (18.8) | |
| Margins | ||||
| Negative | 347 (67.2) | 119 (50.9) | 228 (81.1) | <0.001 |
| Single focus on positive margin | 96 (18.6) | 61 (26.1) | 35 (12.5) | |
| Multifocal positive margin | 70 (13.5) | 54 (23.1) | 16 (5.7) | |
| Follow-up (months) | 24 (12–132) | 36 (12–132) | 24 (12–120) | |
| Mean time to BCR (months) | 12.23±15.58 | NA |
Data are presented in median and range or mean±SD wherever applicable. NA=Not applicable, SD=Standard deviation, BMI=Body mass index, BCR=Biochemical recurrence, ISUP=International Society of Urological Pathology, TRUS=Transrectal ultrasound, NCCN=National Comprehensive Cancer Network, PSA=Prostate-specific antigen, LN=Lymph node, PLND=Pelvic LN dissection, MRI=Magnetic resonance imaging, TURP=Transurethral resection of Prostate; B/L=Bilateral
Multivariate analysis
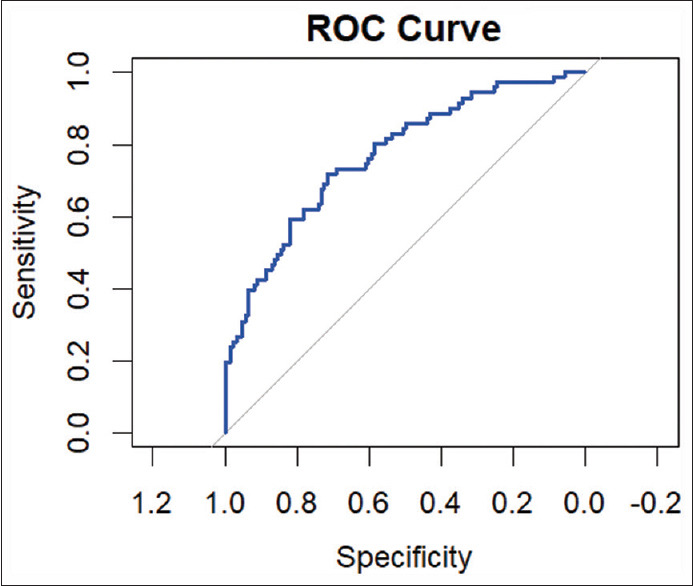
The Cox proportional hazard analysis was utilized for multivariate analysis with the parameters identified as significant in the univariate model. The International Society of Urological Pathology (ISUP) pathological grade, margin status, extracapsular extension, and pathological stage were found to be important model factors by the Cox proportional hazard analysis. Tables 1 and 2 present the findings from the univariate and multivariate analyses, respectively. The area under the curve (AUC) for the multivariate analysis was 0.77 [Table 3 and Figure 1].
Table 2.
Factors found significant on multivariate Cox regression analysis for predicting biochemical recurrence
| Parameter | Multivariate analysis | |
|---|---|---|
|
| ||
| OR | P | |
| ISUP pathological grade | 1.235 (1.081–1.412) | 0.002 |
| Extracapsular extension in LN | 5.972 (2.194–16.257) | 0.004 |
| Margins | 1.331 (1.107–1.600) | 0.002 |
| Pathological stage | 0.827 (0.424–1.613) | 0.08 |
ISUP=International Society of Urological Pathology, LN=Lymph node, OR=Odds ratio
Table 3.
Comparison of all models and the neural network
| Model Name | Accuracy | Sensitivity | Specificity | AUC |
|---|---|---|---|---|
| Cox regression | 0.71 | 0.65 | 0.78 | 0.77 |
| K-nearest neighbor | 0.66 | 0.70 | 0.86 | 0.69 |
| XGBoost model | 0.68 | 0.62 | 0.73 | 0.82 |
| Radial basis NN | 0.75 | 0.72 | 0.79 | 0.82 |
AUC=Area under the curve, XGBoost=Extreme gradient boosting, NN=Neural network
Figure 1.

Receiver-operating characteristic of Cox proportional regression model. ROC = Receiver-operating characteristic
Machine learning models
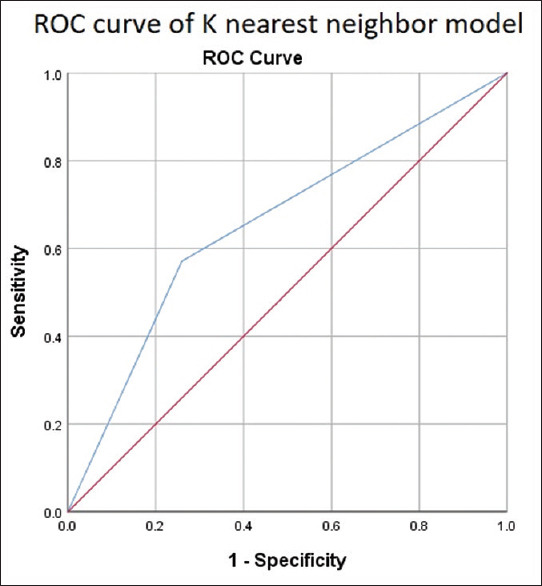
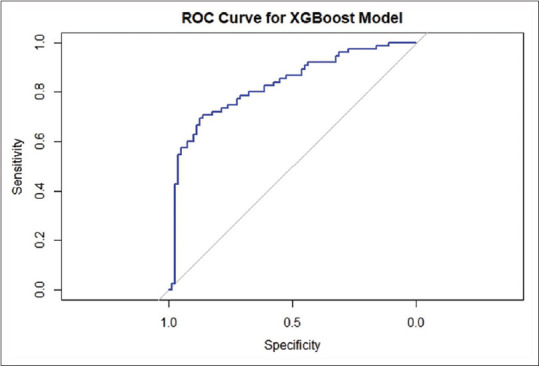
We split the data into training and testing data. Seventy percent of the data were used for training, and 30% of the data were used for testing the model. The factors found significant in the univariate model were used to develop the ML models. The AUCs for ROC curves for KNN [Figure 2] and XGBoost [Figure 3] were 0.69 and 0.82, respectively. The XGBoost model outperformed the conventional statistical regression model in predicting BCR after RP. The increase in AUC from 0.77 to 0.82 is considered significant for model performance. This represents an approximate relative improvement in the model performance by 6.5%. In practical terms, this means that the model’s ability has significantly improved.
Figure 2.

Receiver-operating characteristic curve of K-nearest neighbor. ROC = Receiver -operating characteristic
Figure 3.

Receiver-operating characteristic curve of XGBoost model. ROC = Receiver-operating characteristic
Radial basis function neural network
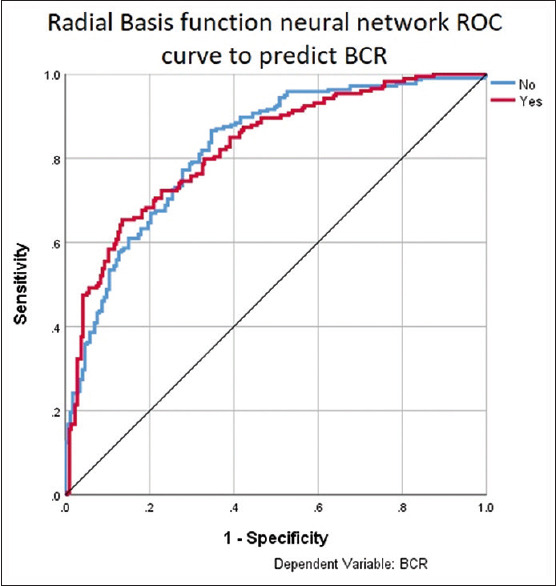
The data were split into testing (70%) and training (30%) sets. Using the preoperative serum PSA, MRI staging, ISUP pathological grade, tumor volume in the final biopsy specimen, number of LN removed, number of positive LN, margin positivity, and pathological stage, an input layer of the NN was created [Figure 4]. A hidden layer was generated with the radial basis function, and the output was the prediction of BCR. The AUC of this model was 0.82 [Table 3 and Figure 5].
Figure 4.

Radial basis function neural network. PSA = Prostate-specific antigen
Figure 5.

Receiver-operating characteristic curve of radial basis function neural network to predict biochemical recurrence. ROC = Receiver-operating characteristic, BCR = Biochemical recurrence
DISCUSSION
AI is anticipated to significantly impact the field of medicine and healthcare in the near future. It is expected to serve as a valuable tool in screening, diagnosing, and managing a wide range of diseases.[1] “AI” refers to computer technologies that aim to replicate human cognitive functions and engage in problem-solving activities. ML and NN are a field of AI. The utilization of advanced techniques in data analysis allows for the exploration and understanding of complex relationships within datasets. This surpasses the traditional methods of constructing predictive models from a given dataset.[8] ML develops algorithms using different combinations of weights and features. It focuses on the learning aspect of AI and can be used to perform different tasks based on the learning method: unsupervised, semi-supervised, supervised, and reinforcement. There are many ML algorithms that can be used.[9]
We used K-nearest neighbor, XGboost ML model to predict BCR. A popular supervised ML technique for disease prediction is KNN. It considers the features and labels of the training set. The KNN technique can usually classify datasets using a training model that is like the testing query by taking into account the k-nearest training data points (neighbors), the ones closest to the query it is testing. The program then determines which classification should be chosen by a majority voting process. This is the simplest and most widely used ML algorithm.[10] XGBoost stands for extreme gradient boosting. It is an advanced form of gradient boosting algorithm. It is also a supervised ML algorithm but highly powerful, scalable, and optimized. It uses multiple decision trees for prediction and every decision tree corrects the mistakes of the previous decision tree. The decision trees are compiled to identify the most important variables and generate the model. It can handle large and complex data much better than other ML algorithms.[11]
K-nearest neighbor had a lower AUC in our study compared to Cox proportional hazard model. This can be due to its poor ability to handle censored data and its degradation in high-dimensional spaces.[12] XG Boost often outperforms both K-nearest neighbor and the Cox model due to its ability to handle complex relations between data, managing high dimensional data and incorporating regularization to prevent overfitting of the data.[13]
We used RBFNN to predict BCR in our study. A NN takes its inspiration from biological NNs or nervous systems. NN are made of nodes, like cell bodies and connections which are such as axons and dendrites. In an Artificial NN, connections are made between the input variables and nodes. The NN assigns weight to the connections between different nodes according to their capacity to produce the desired result. It is like a nervous system in which the synapses are strengthened when the neurons have correlation output. Similar to the Hebbian theory in neuropsychology: “nerves which fire together, wire together.”[9] RBFNN is different from other NN due to their universal approximation and faster learning. It is composed of three different layers – an input layer, a hidden layer, and an output layer. It uses a linear collection of radially symmetric functions to achieve an input–output mapping.[14]
According to available data, the average duration between RP and the occurrence of BCR and distant metastasis was found to be approximately 8 years. Similarly, the average period between the development of metastatic disease and mortality was observed to be around 5 years. The prediction of BCR, a highly significant marker for assessing the progression to mortality in patients with PCa, has consistently been a primary objective for clinicians engaged in PCa research.[15]
AI has various uses in patients with PCa. Hung et al. used ML and deep learning methods to create a DeepSurv model to predict continence after RARP. They showed that surgeons with more efficient automated performance metrics achieved better continence rates.[16] Wong et al. used three different ML models to predict early BCR post-RP. The ML models could predict BCR with higher accuracy than classical statistical techniques.[17]
This study used localized carcinoma prostate patients from all risk groups. We found that the XGBoost model could predict BCR better than classical statistical analysis. An RBFNN was created to predict BCR, which showed better AUC than the classical statistical and ML models. This model can help prognosticate patients, especially the Indian patient population, for BCR prediction.
The primary strengths of our study are the utilization of comprehensive patient data and follow-up time for the accurate diagnosis or exclusion of BCR. However, a significant drawback of our study is its retrospective nature. Furthermore, it is essential to consider that doing research with larger cohorts of PCa patients and more extended follow-up periods would yield dependable data regarding the applicability of our approach in clinical contexts. The development of these new technologies and the integration of them into health-care information management systems will lead to the acquisition of more accurate algorithms for the diagnosis, treatment, and prognosis of diseases. By integrating these methodologies into a unified national and maybe global network in the future, clinicians will have immediate access to reliable estimations.
CONCLUSION
This study demonstrated that RBFNN and XGBoost models outperform traditional statistical models in predicting BCR. Creating more efficient models would assist medical professionals and patients. It is anticipated that the use of ML and NN methods in health-care settings will experience a rise in the future.
Financial support and sponsorship
Nil.
Conflicts of interest
There are no conflicts of interest.
REFERENCES
- 1.Shah M, Naik N, Somani BK, Hameed BM. Artificial Intelligence (AI) in urology-current use and future directions: An iTRUE study. Turk J Urol. 2020;46:S27–39. doi: 10.5152/tud.2020.20117. [DOI] [PMC free article] [PubMed] [Google Scholar]
- 2.Gillessen S, Bossi A, Davis ID, de Bono J, Fizazi K, James ND, et al. Management of patients with advanced prostate cancer. Part I: Intermediate-/high-risk and locally advanced disease, biochemical relapse, and side effects of hormonal treatment: Report of the advanced prostate cancer consensus conference 2022. Eur Urol. 2023;83:267–93. doi: 10.1016/j.eururo.2022.11.002. [DOI] [PMC free article] [PubMed] [Google Scholar]
- 3.Freedland SJ, Humphreys EB, Mangold LA, Eisenberger M, Dorey FJ, Walsh PC, et al. Risk of prostate cancer-specific mortality following biochemical recurrence after radical prostatectomy. JAMA. 2005;294:433–9. doi: 10.1001/jama.294.4.433. [DOI] [PubMed] [Google Scholar]
- 4.Diaz M, Peabody JO, Kapoor V, Sammon J, Rogers CG, Stricker H, et al. Oncologic outcomes at 10 years following robotic radical prostatectomy. Eur Urol. 2015;67:1168–76. doi: 10.1016/j.eururo.2014.06.025. [DOI] [PubMed] [Google Scholar]
- 5.Thompson IM, Tangen CM, Paradelo J, Lucia MS, Miller G, Troyer D, et al. Adjuvant radiotherapy for pathological T3N0M0 prostate cancer significantly reduces risk of metastases and improves survival: Long-term followup of a randomized clinical trial. J Urol. 2009;181:956–62. doi: 10.1016/j.juro.2008.11.032. [DOI] [PMC free article] [PubMed] [Google Scholar]
- 6.Cooperberg MR, Hilton JF, Carroll PR. The CAPRA-S score: A straightforward tool for improved prediction of outcomes after radical prostatectomy. Cancer. 2011;117:5039–46. doi: 10.1002/cncr.26169. [DOI] [PMC free article] [PubMed] [Google Scholar]
- 7.Sharma G, Darlington D, Ahluwalia P, Gautam G. Development and internal validation of preoperative and postoperative nomograms predicting quadrifecta outcomes following robotic radical prostatectomy. Indian J Urol. 2022;38:197–203. doi: 10.4103/iju.iju_381_21. [DOI] [PMC free article] [PubMed] [Google Scholar]
- 8.Ahmed Z, Mohamed K, Zeeshan S, Dong X. Artificial intelligence with multi-functional machine learning platform development for better healthcare and precision medicine. Database (Oxford) 2020;2020:baaa010. doi: 10.1093/database/baaa010. [DOI] [PMC free article] [PubMed] [Google Scholar]
- 9.Choi RY, Coyner AS, Kalpathy-Cramer J, Chiang MF, Campbell JP. Introduction to machine learning, neural networks, and deep learning. Transl Vis Sci Technol. 2020;9:14. doi: 10.1167/tvst.9.2.14. [DOI] [PMC free article] [PubMed] [Google Scholar]
- 10.Uddin S, Haque I, Lu H, Moni MA, Gide E. Comparative performance analysis of K-nearest neighbour (KNN) algorithm and its different variants for disease prediction. Sci Rep. 2022;12:6256. doi: 10.1038/s41598-022-10358-x. [DOI] [PMC free article] [PubMed] [Google Scholar]
- 11.Tarwidi D, Pudjaprasetya SR, Adytia D, Apri M. An optimized XGBoost-based machine learning method for predicting wave run-up on a sloping beach. MethodsX. 2023;10:102119. doi: 10.1016/j.mex.2023.102119. [DOI] [PMC free article] [PubMed] [Google Scholar]
- 12.Bradburn MJ, Clark TG, Love SB, Altman DG. Survival analysis part II: Multivariate data analysis –An introduction to concepts and methods. Br J Cancer. 2003;89:431–6. doi: 10.1038/sj.bjc.6601119. [DOI] [PMC free article] [PubMed] [Google Scholar]
- 13.Chen T, Guestrin C. XGBoost: A Scalable Tree Boosting System. Proceedings of the 22nd ACM SIGKDD International Conference on Knowledge Discovery and Data Mining. KDD '16. Association for Computing Machinery. 2016:785–94. [Google Scholar]
- 14.Radial Basis Function Network –An Overview |ScienceDirect Topics. [Last accessed on 2024 May 15]. Available from: https://www.sciencedirect.com/topics/engineering/radial-basis-function-network .
- 15.Pound CR, Partin AW, Eisenberger MA, Chan DW, Pearson JD, Walsh PC. Natural history of progression after PSA elevation following radical prostatectomy. JAMA. 1999;281:1591–7. doi: 10.1001/jama.281.17.1591. [DOI] [PubMed] [Google Scholar]
- 16.Hung AJ, Chen J, Ghodoussipour S, Oh PJ, Liu Z, Nguyen J, et al. Adeep-learning model using automated performance metrics and clinical features to predict urinary continence recovery after robot-assisted radical prostatectomy. BJU Int. 2019;124:487–95. doi: 10.1111/bju.14735. [DOI] [PMC free article] [PubMed] [Google Scholar]
- 17.Wong NC, Lam C, Patterson L, Shayegan B. Use of machine learning to predict early biochemical recurrence after robot-assisted prostatectomy. BJU Int. 2019;123:51–7. doi: 10.1111/bju.14477. [DOI] [PubMed] [Google Scholar]


