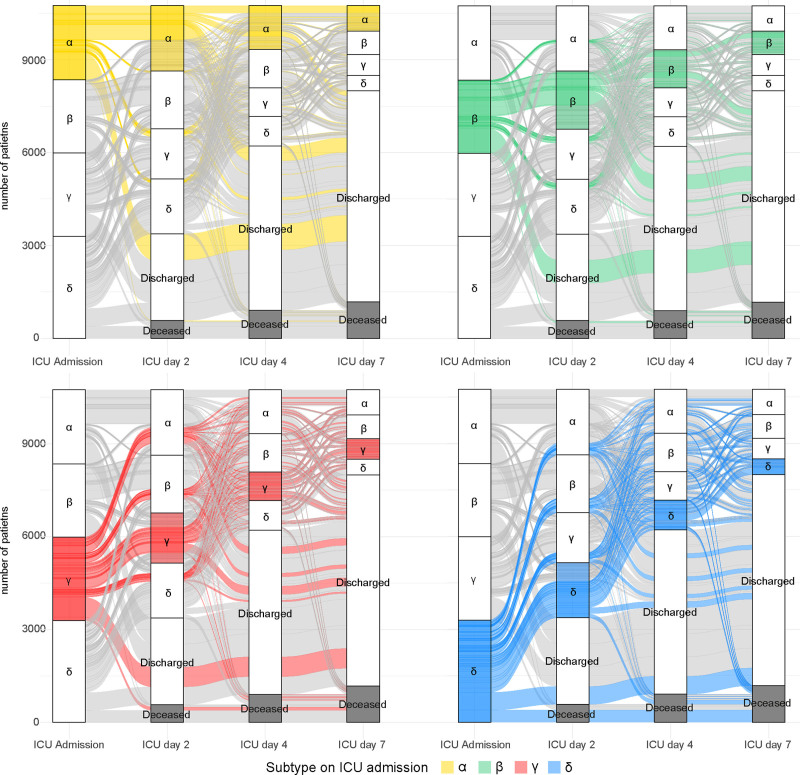
Figure 3.
Distribution of subtypes in the Medical Information Mart for Intensive Care-IV (MIMIC-IV) cohort. Distribution of subtypes displayed on ICU admission, days 2, 4, and 7 in the MIMIC-IV cohort. Subtype distribution in sepsis patients admitted to the ICU displayed per subtype at admission in the MIMIC-IV cohort. At admission, 2398 patients (22.3%) has the α subtype (top left, yellow), 2365 patients (22.0%) β (top right, green), 3296 (30.8%) γ (bottom left, red), and 2686 (25.0%) δ (bottom right, blue). The number of patients that are deceased at that time point are shown in gray.

