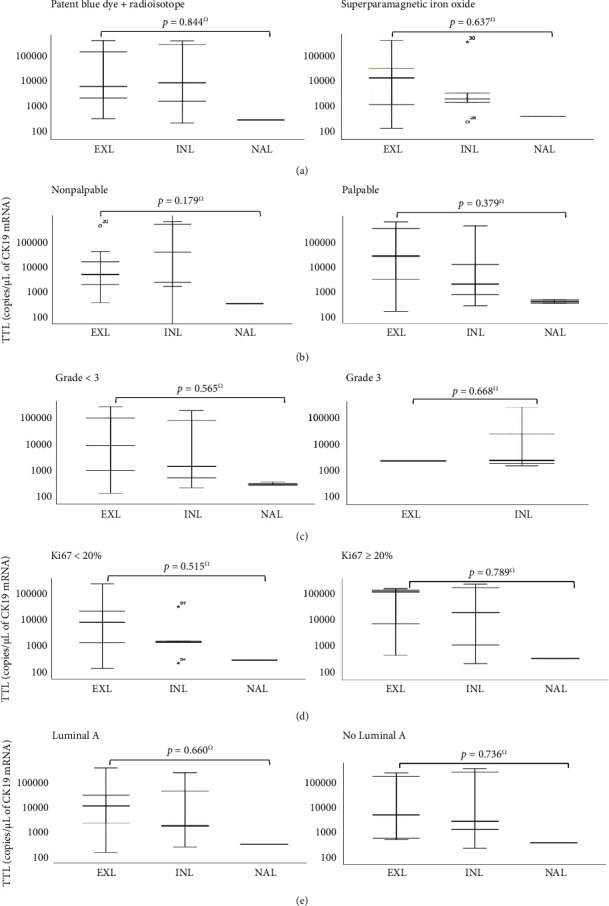
Figure 2.

Box-plot graphics representing the subgroup analysis performed to evaluate the association of TTL with different clinicopathologic parameters among the EXL (external quadrants and axillary tail), INL (internal quadrants), and NAL (nipple and areola location) groups: (a) Technique used for SLN detection; (b) palpability; (c) tumor grade; (d) Ki67 index; (e) intrinsic molecular subtype. Ω: one-way ANOVA.
