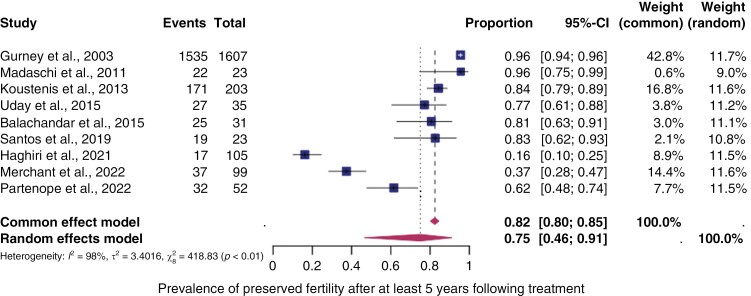
Figure 3.
Pooled prevalence of preserved fertility. Forest plot of proportions and 95% confidence intervals (CI) for studies evaluating the prevalence of preserved fertility after central nervous system cancer treatments. Preserved fertility was defined as the absence of gonadal toxicity including primary/secondary amenorrhea, no central/primary/secondary hypogonadism, or panhypopituitarism. Squares for each study indicate the proportion, the size of the boxes indicates the weight of the study, and the horizontal lines indicate the 95% CI. The data in bold and diamond represent the pooled prevalence for post-treatment infertility in good prognosis patients and 95% CI. Overall estimates are shown in the fixed- and random-effect models.

