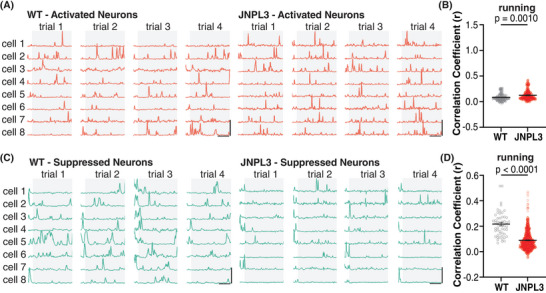
FIGURE 5.

Differential changes of neuronal activity correlation in neurons with activated versus suppressed response to running in JNPL3 mice. (A) Representative Ca2+ trace of neurons with an activated response in a WT and a JNPL3 mouse in running trials. Gray background/box depicts running periods, whereas clear background/box denotes resting periods. (B) Ca2+ activity correlation in neurons with an activated response to running. The same analyses of correlation indexes were performed as in Figure 3B. A total of 129 neurons (7 animals) from WT and 224 neurons from JNPL3 (18 animals) were included. (C) Representative Ca2+ trace of neurons with a suppressed response during running in a WT and a JNPL3 mouse. (D) Ca2+ activity correlation in neurons with a suppressed response to running. The same analyses of correlation indexes were performed as in Figure 3B. A total of 52 neurons (7 animals) from WT and 451 neurons from JNPL3 (18 animals) were included. Unpaired t‐test in (H) and (J). WT, wild‐type.
