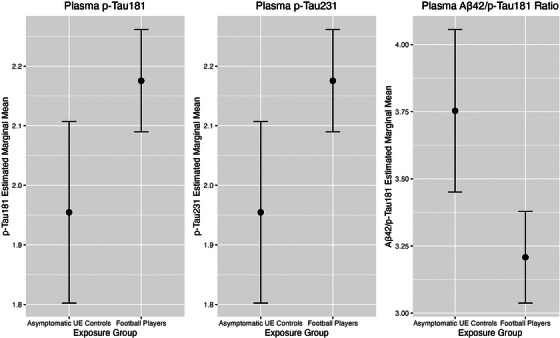
FIGURE 1.

Estimated marginal means plot—pT181, pT231. ANCOVA compared concentrations of plasma biomarkers in football players and asymptomatic UE participants. Above figure shows the differences in estimated marginal means between football players and asymptomatic UE exposure groups for plasma p‐Tau181, p‐Tau231, and the Aβ42/p‐Tau181 ratio. All models adjusted for age, race, BMI, rFSRP, and total AUDIT score. Error bars at 95% CI. (a) p‐Tau181. (b) p‐Tau231. (c). Aβ42/p‐Tau181. ANCOVA, analysis of covariance; AUDIT, alcohol use disorders identification test; BMI, body mass index; CI, confidence interval; p‐tau, hyper‐phosphorylated tau; rFSRP, revised Framingham Stroke Risk Profile; UE, unexposed
