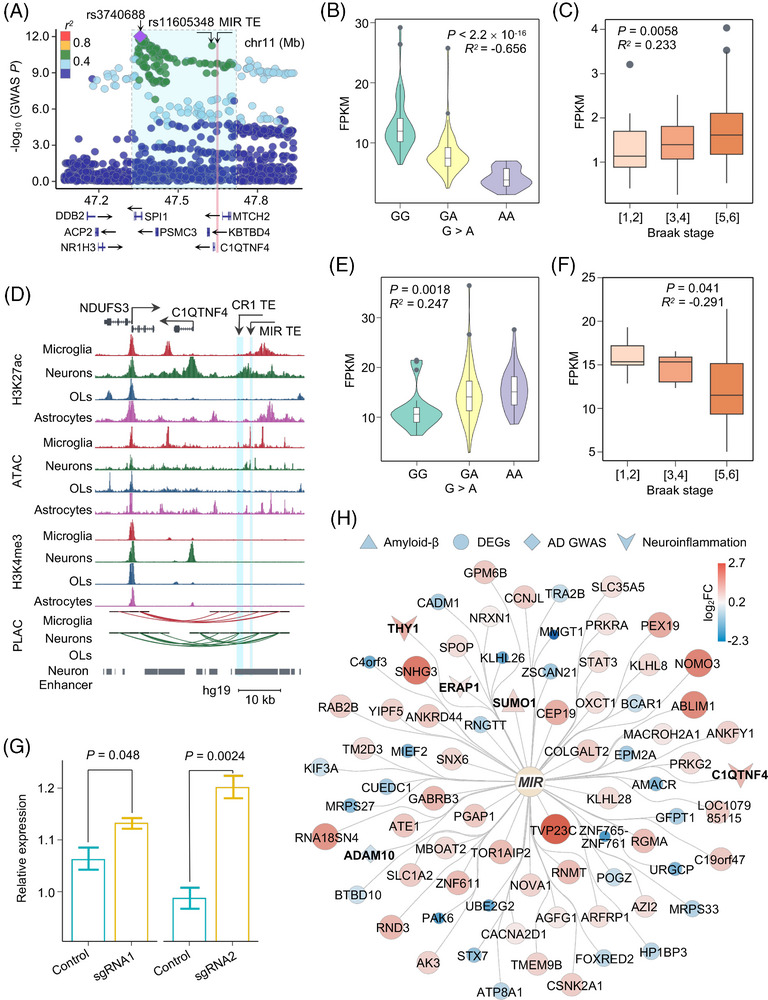
FIGURE 6.

CRISPR interference reveals neuron‐specific suppressive role of upregulated MIR family TE on anti‐inflammatory response. A, Regional SNP association plots with TE from a SINE element (chr11: 47608036‐47608220) shown in LD blocks of rs3740688 in AD. Plots are colored based on LD bins relative to the lead SNPs rs3740688 (red, 0.8; orange, 0.6–0.8; green, 0.4–0.6; light blue, 0.2–0.4; and dark blue, < 0.2). The SNP pairwise LD data were calculated based on 1000 Genomes Phase 3 (ALL) reference panel. Gene annotations: the National Center for Biotechnology Information RefSeq Select database. Assembly GRCh37, scale in Mb. B, E, Expression level of the TE from a SINE element (chr11: 47608036‐47608220) (B) and C1QTNF4 (E) showed significant correlation with the presence of risk allele rs11605348. D, UCSC Genome Browser visualization of chromatin interactions between the SINE and LINE element TE‐located neuron‐specific enhancer and promoter regions of C1QTNF4 and NDUFS3, respectively. C, F, Expression of the TE from a SINE element (chr11: 47608036‐47608220) (C) and C1QTNF4 (F) showed significant correlation with the clinical Braak staging score. P values are calculated using the Spearman correlation test. R values showing the strength of expression correlation by Spearman correlation test. G, Box plot shows relative expression of C1QTNF4 between control (green) or SINE element (chr11: 47608036‐47608220) sgRNA (yellow) targeted iPSC‐derived neurons. H, Network depicting the significantly dysregulated genes from RNA‐seq analysis upon a SINE element (chr11: 47608036‐47608220) perturbation in iPSC‐derived neurons. Circles in the inner layer represent TE families. Genes on the outer layer surface refer to the dysregulated genes. Diamonds represent AD GWAS genes, triangles represent genes associated with Aβ, V represents neuroinflammation associated genes, and circles represent other differentially expressed genes. Colors and size on the outer layer panel refer to log2FC of differentially expressed genes from the RNA‐seq analysis. Genes related with Aβ, neuroinflammation, and GWAS traits are shown in bold fonts. Aβ, amyloid beta; AD, Alzheimer's disease; GWAS, genome‐wide association study; iPSC, induced pluripotent stem cell; LD, linkage disequilibrium; LINE, long interspersed nuclear element; OLs, oligodendrocytes; RNA‐seq, RNA‐sequencing; SINE, short interspersed nuclear element; SNP, single nucleotide polymorphism; TE, transposable element; UCSC, University of California Santa Cruz.
