
FIGURE 3.
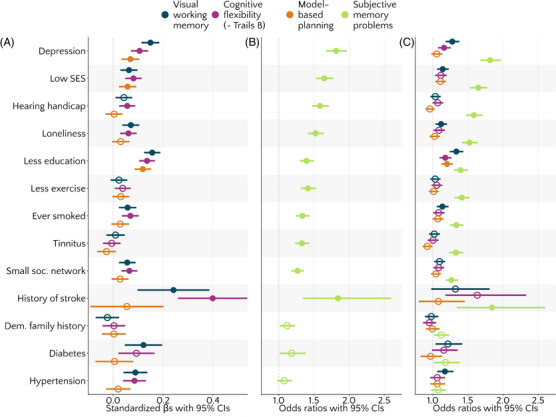
Associations between cognitive measures and risk factors, controlling for age and gender. Filled circles represent values significant at p < .0038, that is, after applying Bonferroni correction per dependent variable. Higher estimates indicate worse cognitive outcomes. Circles and lines represent (A) standardized beta estimates with 95% confidence intervals (CIs) or (B and C) odds ratios with 95% CIs. In (C), objective cognitive scores were binarized to enable direct comparison of odds ratios with subjective memory problems.