FIGURE 3.

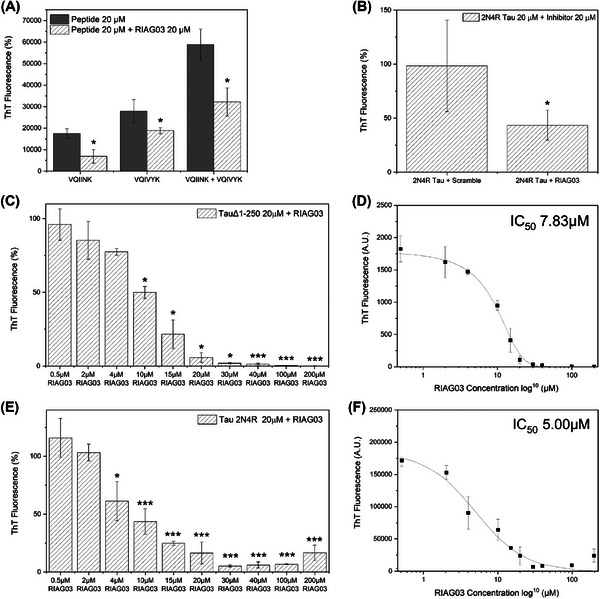
Lead peptide RI‐AG03 dose‐response and target specificity. (A) Aggregation end‐point measurements using ThT fluorescence after 24 h from 20 µM VQIINK, 20 µM VQIVYK, or a combination of both, in the presence of 30 mM Tris buffer, 1 mM DTT, 15 µM ThT, 5 µM heparin (pH 7.4), and in the presence (hatched gray bars) or absence (solid gray bars) of 20 µM RI‐AG03. (B) Aggregation end‐point measurements using ThT fluorescence after 216 h (9 days) from Tau2N4R in the presence of PBS buffer, 1 mM DTT, 20 µM ThT, 10 µM heparin (pH 7.4), and 20 µM RI‐AG03 or 20 µM Scramble peptide. (C) Concentration‐dependent inhibition of by TauΔ1‐250 by RI‐AG03. Aggregation end‐point measurements using ThT fluorescence after 24 h from 20 µM TauΔ1‐250 in the presence of 30 mM Tris buffer, 1 mM DTT, 15 µM ThT, 5 µM heparin (pH 7.4), and RI‐AG03 in a concentration range of 0.5–200 µM. (D) log10 scatter graph of TauΔ1‐250 inhibition by RI‐AG03 employing a curve fitting algorithm to calculate the IC50 (the concentration of RI‐AG03 required for 50% inhibition of aggregation) at 7.83 µM. (E) Concentration‐dependent inhibition of by Tau2N4R by RI‐AG03. Aggregation end‐point measurements using ThT fluorescence after 216 h (9 days) of Tau2N4R in the presence of PBS buffer, 1 mM DTT, 20 µM ThT, 10 µM heparin (pH 7.4), and RI‐AG03 in a concentration range of 0.5–200 µM. (F) log10 scatter graph of Tau2N4R inhibition by RI‐AG03 employing a curve fitting algorithm to calculate the IC50 at 5 µM. Experiments were conducted in triplicate and error bars were reported as standard deviation. One factor repeated measures ANOVA + Tukey post hoc statistical analysis: p > 0.05, *p ≤ 0.05, **p ≤ 0.01, ***p ≤ 0.001.
