
FIGURE 5.
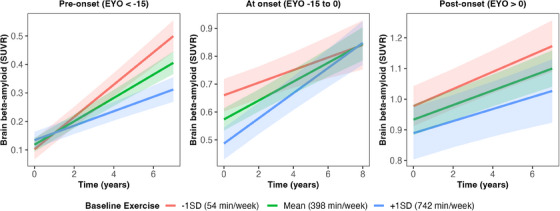
Baseline exercise x time on brain Aβ (log) in subsets of EYO stages (i.e., EYO groups were created). Data were subset based on EYO because of a non‐linear association between EYO and brain Aβ (Figure S2 in supporting information). The left panel demonstrates the change in Aβ over time separated by exercise level within the pre‐onset group (n = 80), the middle panel demonstrates change over time in those nearing EYO (n = 109), the right panel demonstrates those post EYO (n = 94). Gray bands represent 95% confidence intervals. Aβ, amyloid beta; EYO, estimated years from expected symptom onset; SD, standard deviation