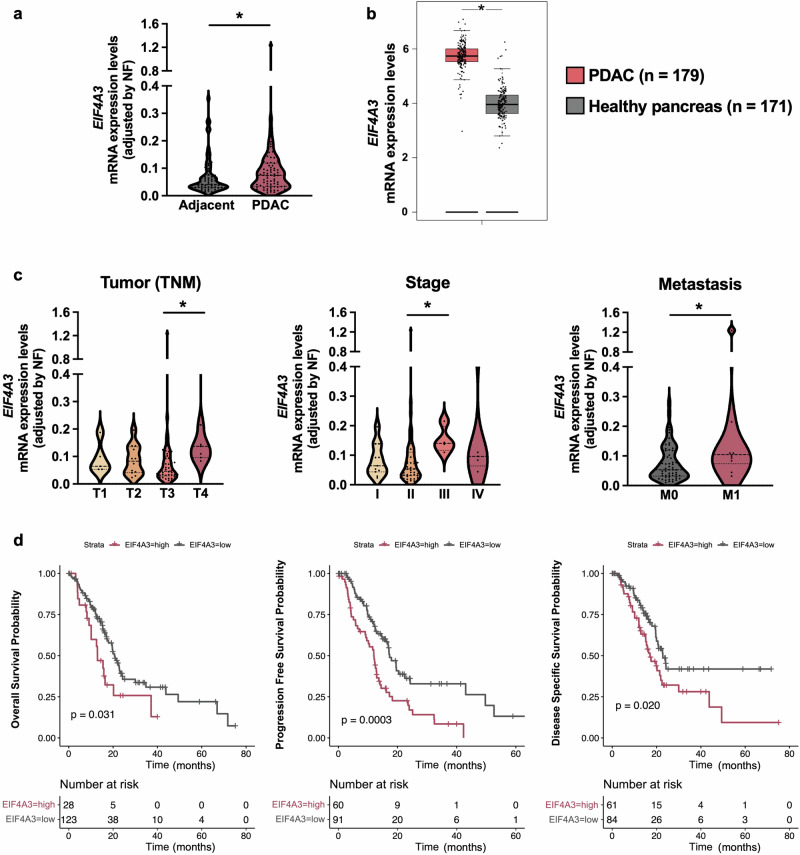
Fig. 1. Overexpression of EIF4A3 in PDAC is associated with malignancy features.
a EIF4A3 expression in PDAC tumor tissue (n = 73) compared to non-tumor adjacent tissue (n = 65) as measured by qPCR microfluidic array in the Discovery Cohort. b EIF4A3 expression in The Cancer Genome Atlas (TCGA) PDAC tumors (n = 179) compared to Normal Pancreas (n = 171) expression from The Genotype-Tissue Expression (GTEx). Graphic was obtained by GEPIA web server [62]. c Association of EIF4A3 expression levels in tumor tissue to TNM stage (T1 n = 5, T2 n = 12, T3 n = 44, T4 n = 7), tumor stage (I n = 11, II n = 49, III n = 4, IV n = 5) and metastasis (M0 n = 57, M1 n = 10) in the Discovery Cohort. Data represent mean ± SEM. Mann–Whitney U test was used to compare means between two groups, and the Kruskal–Wallis test was used to compare means among more than two groups. When the Kruskal–Wallis test indicated significant differences, post hoc Dunn’s test was employed to identify differences between groups pairs. Asterisks indicate significant differences (*p < 0.05). d Association of EIF4A3 expression levels in tumor tissue to poorer overall, progression free and disease specific survival probability in PDAC patients from the PanCancer study. Logrank tests indicate statistical significance and p values are represented.

