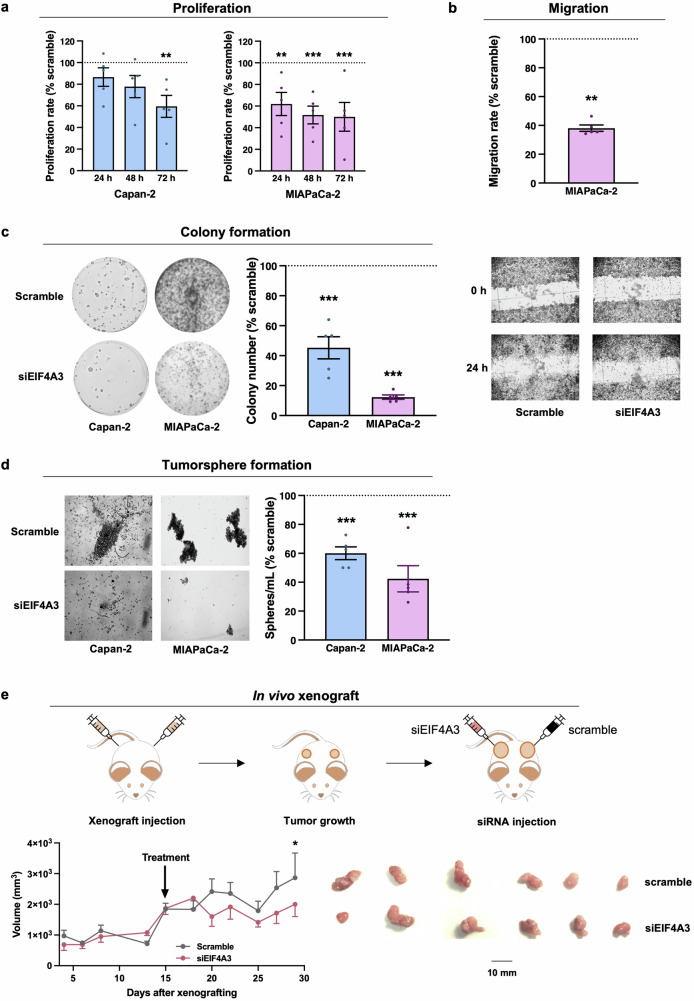
Fig. 3. Functional effects of EIF4A3 targeting in PDAC models.
a Proliferation rates of Capan-2 and MIAPaCa-2 cell lines in response to EIF4A3 silencing at 24, 48 and 72 h compared to scramble silenced cells (n = 5). Mean differences were assessed using ANOVA, with post hoc Tukey’s test to compare between group pairs. b Migration rate of MIAPaCa-2 cells in response to EIF4A3 silencing compared to scramble silenced cells set at 100% (n = 5). Representative images are shown below. c Colony formation capacity of Capan-2 and MIAPaCa-2 cells in response to EIF4A3 silencing compared to scramble silenced cells set at 100% (n = 5). Representative images are shown at the left. d Tumorsphere formation capacity of Capan-2 and MIAPaCa-2 cells in response to EIF4A3 silencing compared to scramble silenced cells set at 100% (n = 5). Representative images are shown at the left. e EIF4A3 targeting reduces tumor volume in vivo (n = 6). At top panel, scheme of the xenograft experiment carried out; at bottom-left panel, volume of the tumors (EIF4A3 and scramble silenced groups) during the full experiment; at bottom-right panel, a picture of the tumors after the mice sacrifice. Data represent mean ± SEM. Mean differences were assessed using t-test for (b–e). Asterisks indicate significant differences (*p < 0.05; **p < 0.01; ***p < 0.001).

