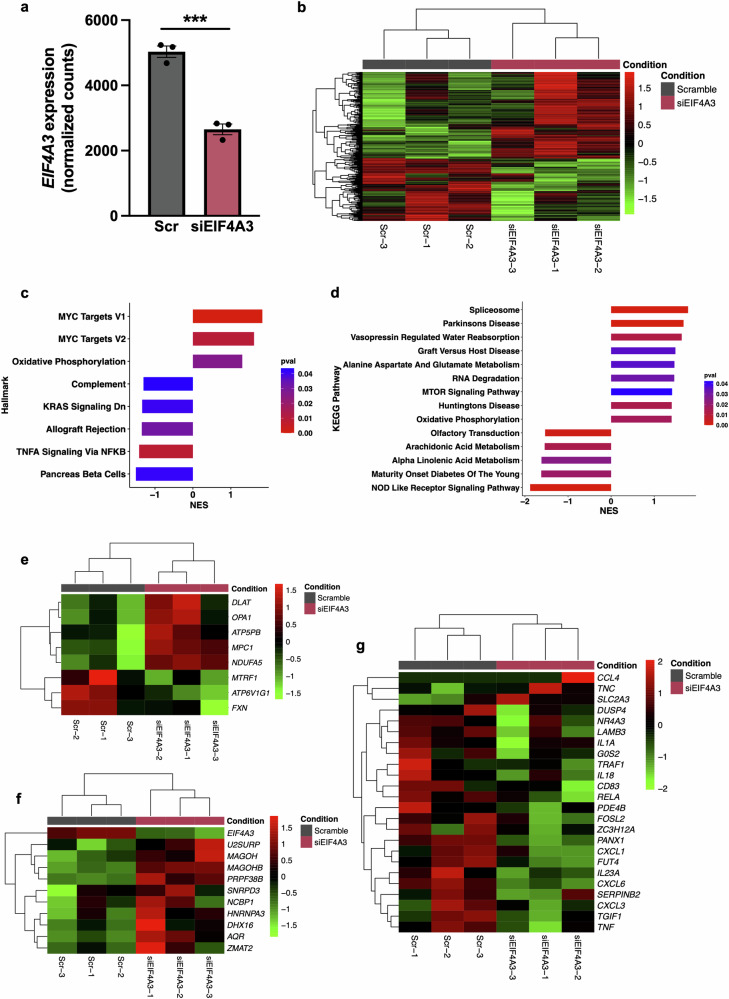
Fig. 4. Changes in the transcriptional profile of MIAPaCa-2 cells in response to EIF4A3 silencing.
a Normalized EIF4A3 expression—as VST counts from DESeq2—in scramble vs. EIF4A3 silenced MIAPaCa-2 cells (n = 3). Data represent mean ± SEM. Mean differences were assessed using t-test. Asterisks indicate significant differences (***p < 0.001). b Heatmap showing the differentially expressed genes (DEG) by DESeq2 in scramble vs. EIF4A3 silenced MIAPaCa-2 cells. c Analysis of Hallmarks altered due to EIF4A3 silencing in MIAPaCa-2 cells. Normalized enrichment score (NES) is positive for hallmarks enriched in EIF4A3 silenced cells and NES is negative for those enriched in scramble silenced cells. Bars color represents p value for each pathway. d Analysis of KEGG pathways altered due to EIF4A3 silencing in MIAPaCa-2 cells. NES is positive for hallmarks enriched in EIF4A3 silenced cells and NES is negative for those enriched in scramble silenced cells. Bars color represents p value for each pathway. Heatmap showing the DEG expression from the oxidative phosphorylation (e), the spliceosome (f) and the TNF-α (g) pathways.

