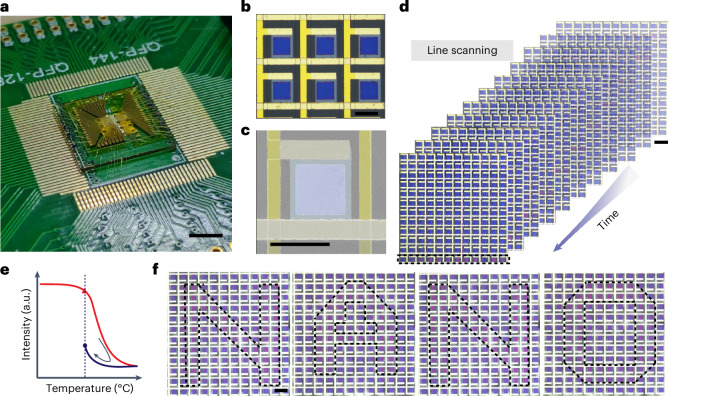
Fig. 5. Demonstration of a structural colour display.
a, Photograph of the prototype of the structural colour matrix. b,c, The optical images (b) and a false-colour scanning electron microscope image (c) of the structural colour pixels. d, Line-scanning screenshots at different times. e, The principle of a non-volatile display. The red triangle marks the starting point, and the blue disc is the final state of the device. f, The patterns of sequentially appearing letters (one letter pattern at a time) showing ‘NANO’, based on the hysteresis effect. Dashed lines are included only for ease of observation. Scale bars, 1 cm in a, 50 µm in b and c and 100 µm in d and f.

