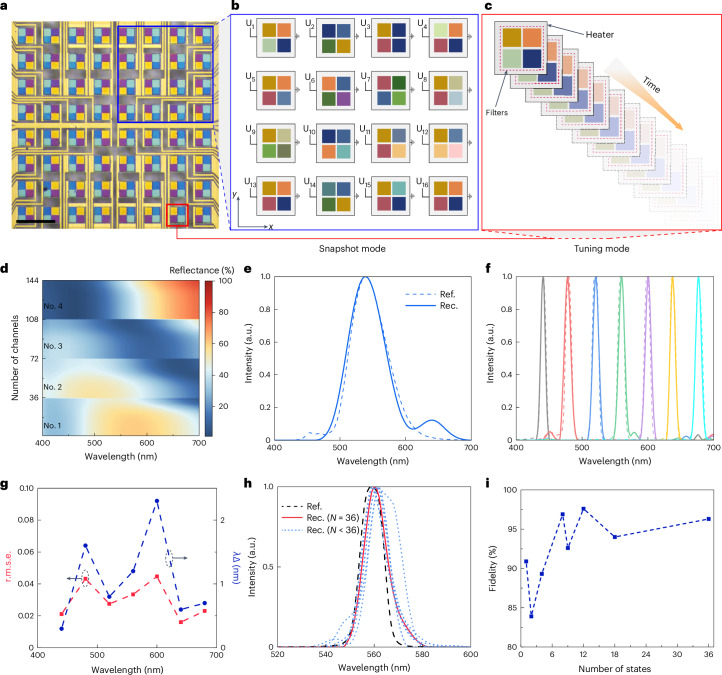
Fig. 6. Spectrum detection through spatiotemporal modulation.
a, The optical image of the tetrachromatic filter matrix for spectrum detection. Scale bar, 200 μm. b, An enlarged view of a chosen region (a large part of the filter matrix, indicated by a blue box in a), where each unit filter is activated to a specific intermediate state with a different specific voltage, labelled Un. This illustrates the principle for spectrum detection in snapshot mode. c, An enlarged view for a single unit filter (indicated by a red box in a), which is activated to different intermediate states with different voltages in a time sequence. This illustrates the principle for spectrum detection in tuning mode. d, The reflective spectra of the tetrachromatic filter used for spectrum reconstruction. Each filter is set to 36 intermediate states, and the whole channel number (the total number of filters multiplied by the total number of intermediate states) used for spectrum reconstruction is 144. e,f, The reconstructed results for broadband (e) and narrowband (f; with a bandwidth about 10 nm) signals. The dashed lines (Ref.) are the ground truth measured by a commercial spectrometer, and the solid lines are reconstructed results (Rec.). g, The reconstruction performance for narrowband signals. h, The reconstructed performance with different numbers of states. The dashed line is the ground truth measured by a commercial spectrometer; the solid line is the reconstructed spectrum with a total number of states, N = 36; and the dotted lines are reconstructed spectra with N = 1, 2, 4, 8, 9, 12 and 18. i, The corresponding fidelity calculated from h. The dashed lines in g and i only provide connections to the points to show the general tendency.

