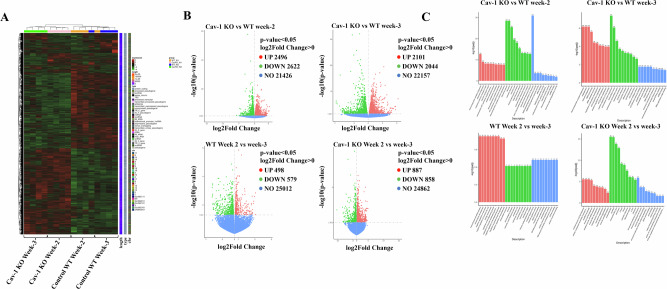
Fig. 3. RNA was isolated from each tumor group, and mRNA sequencing analysis was performed.
A Heat map showing cluster analysis of differentially expressed genes in Cav-1 KO and WT 4T1 cell-induced tumors; B Volcano plot showing differential gene expression between Cav-1 KO and WT 4T1 cell-induced tumors at weeks 2 and 3. DEG were also plotted between WT with WT and KO with KO between week 2 and 3 (C). DEG (padj < 0.05) were categorized into biological processes (BP), cellular component (CC), and molecular function (MF). DESeq at threshold DESeq2, P-value ≤ 0.05.

