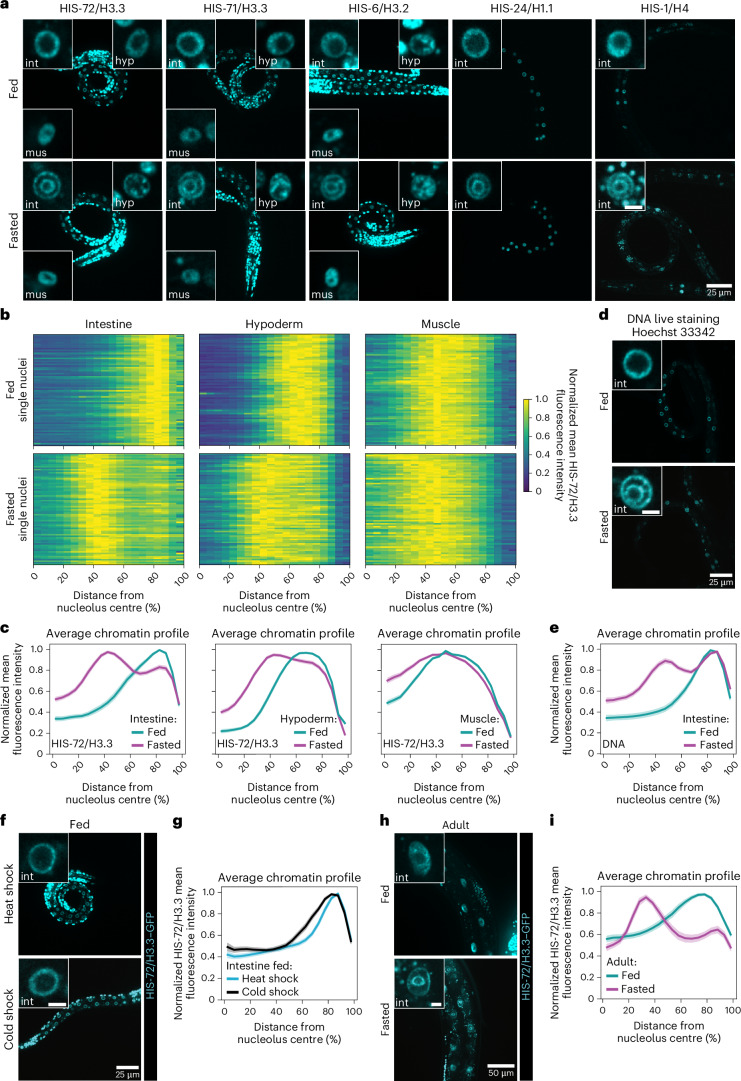
Fig. 1. Fasting induces a large-scale genome reorganization in the C. elegans intestine.
a, Single focal planes of representative WT L1 larvae expressing the indicated fluorescently tagged histone, regularly fed or fasted. Insets: zoom of single nucleus of the indicated tissue. Hyp: hypoderm; int: intestine; mus: muscle. Inset scale bar, 2.5 μm. b, Heat maps showing the radial fluorescence intensity profiles of HIS-72/H3.3–GFP in intestinal, hypodermal and muscle nuclei of fed and fasted WT animals as a function of the relative distance from the nucleolus centre. Each row corresponds to a single nucleus, segmented in 2D at its central plane. Seventy-two intestinal nuclei were analysed in animals from three independent biological replicas. c, Line plots of the averaged single nuclei profiles shown in b. The shaded area represents the 95% confidence interval of the mean profile. Single-peak profiles were compared to estimate the statistical significance of differences, as described in the methods. P values are given in Supplementary Table 2. d, As in a but for Hoechst 33342 live-stained animals to visualize DNA. Insets: zoom of single intestinal nucleus. e, Line plots as in c but of the averaged single nuclei profile of Hoechst 33342-stained DNA from 72 intestinal nuclei of fed and fasted animals from three independent biological replicas. f, As in a but of fed L1s expressing HIS-72/H3.3–GFP heat shocked at 34 °C or cold shocked at 4 °C for 6 h. Insets: zoom of single intestinal nucleus. g, Line plots as in c but of the averaged single nuclei profile of HIS-72/H3.3–GFP from 48 intestinal nuclei of L1s either heat shocked or cold shocked, from two independent biological replicas. h, Single focal planes of representative adults expressing HIS-72/H3.3–GFP, regularly fed or 12 h fasted. Insets: zoom of single intestinal nucleus, scale bar 5 μm. i, Line plots as in c but of the averaged single nuclei profile of HIS-72/H3.3–GFP from 60 intestinal nuclei of fed and fasted adults from three independent biological replicas. For e, g and i, heat maps of single nuclei profiles are provided in Extended Data Fig. 1e,l,m, respectively. Source numerical data are available in Source data.

