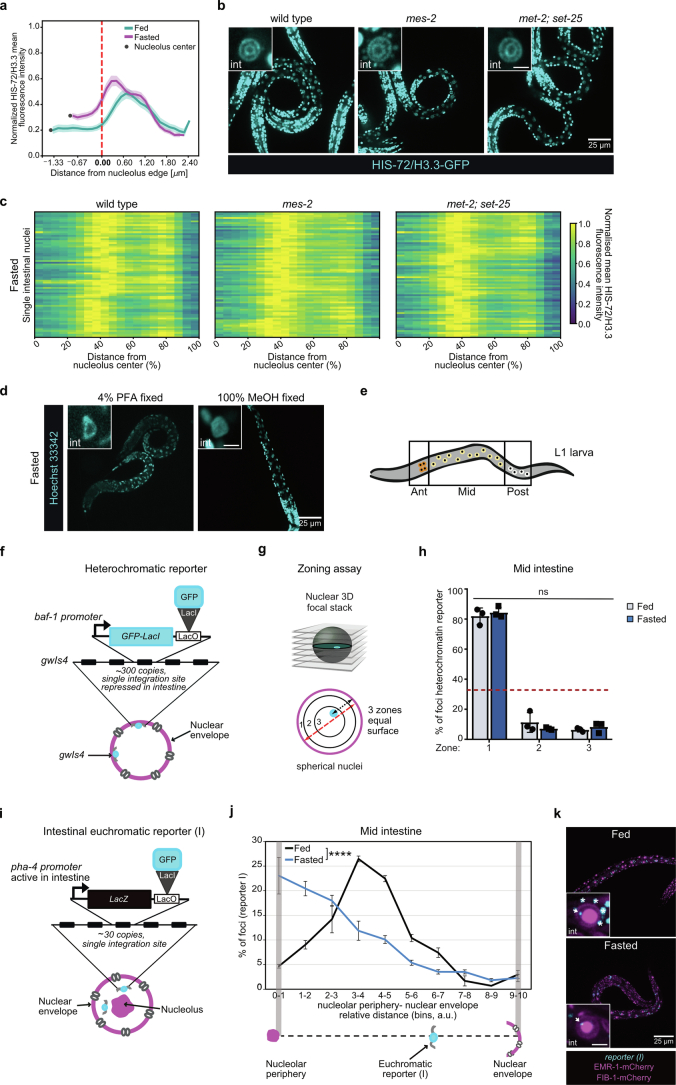
Extended Data Fig. 2. related to Fig. 2.
a, Line plot of the average distance of the HIS-72/H3.3-GFP signal from the nucleolus edge, identified using FIB-1-mCherry, in single intestinal nuclei of fed and fasted L1 larvae. The shaded area represents the 95% confidence interval of the mean profile. 72 intestinal nuclei were analysed in animals from 3 independent biological replicas. b, Single focal planes of representative fasted L1 larvae of the indicated genotype, expressing fluorescently tagged HIS-72/H3.3. Insets: zoom of single intestinal nucleus. Inset scale bar, 2.5 μm. c, Heatmaps showing the radial fluorescence intensity profiles of HIS-72/H3.3-GFP in intestinal nuclei of fasted L1 larvae of the indicated genotype as a function of the relative distance from the nucleolus center. Each row corresponds to a single nucleus, segmented in 2D at its central plane. 70 intestinal nuclei were analysed in animals from 3 independent biological replicas. d, As in (b) but of representative wt L1 larvae fasted, fixed with the indicated chemical and stained with Hoechst 33342 to visualize DNA. e, Schematic representation of intestinal nuclei in L1 larvae. f, Schematic representation of the heterochromatic reporter used in (h). g, Zoning assay for GFP-LacI marked heterochromatic reporter distribution. Radial position is determined relative to the fluorescently-tagged nuclear membrane, and values are binned into three concentric zones of equal surface. Zone 1 is the most peripheral. h, Heterochromatic reporter distribution quantitation, as described in (g), in mid intestine cells of wt fed and fasted L1 larvae. Red dashed line indicates random distribution of 33%. Animals from 3 independent biological replicas, with at least 70 GFP-LacI spots per replicate, were analysed. Data are shown as mean ± SEM. By χ2 test, fed and fasted samples are not significantly (ns) different from each other. p value and exact n are in Supplementary Table 2. i, Schematic representation of the euchromatin reporter (I) used in (j) and (k). j, Line plots of the percentage of alleles represented in (i) found at the indicated relative position between the nucleolus and the nuclear envelope in fed and fasted animals. Data are shown as mean ± SEM of 3 independent biological replicas. p value by χ2 is shown; **** indicates a p value < 0.0001. See n and p values in Supplementary Table 2. k, As in (b), but for wt L1 larvae expressing the indicated fluorescently-tagged markers, fed or fasted. * mark autofluorescence from the intestinal cytoplasm. Source numerical data are available in source data.

